Archived - A Home Gardener’s Guide to Soils and Fertilizers (Home Garden Series)
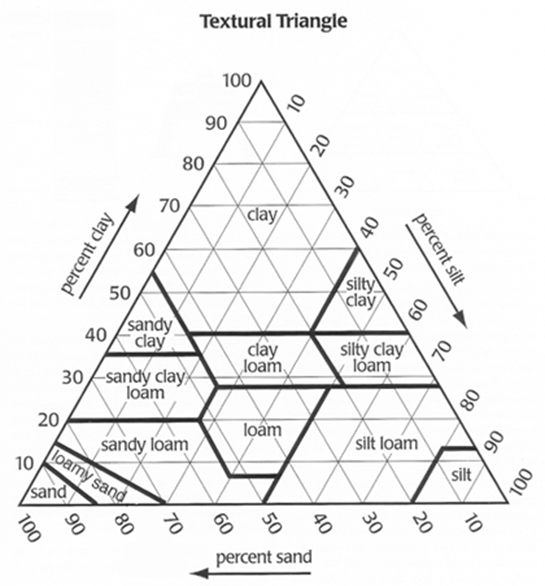
Nearly all soils have a mixture of particle sizes (Figure 1). A soil with roughly equal influence from sand, silt, and clay particles is called a loam. Loams usually make good agricultural and garden soils because they have a good balance of macropores and micropores. Thus, they usually have good water-holding capacity and moderate permeability.
A sandy loam is similar to a loam, except that it contains more sand. It feels gritty, yet has enough silt and clay to hold together in your hand. Sandy loams usually have low to moderate water- holding capacity and good permeability. Silt loams are richer in silt and feel smooth rather than gritty. They are pliable when moist, but not very sticky. Silt loams usually have high water- holding capacity and low to moderate permeability.
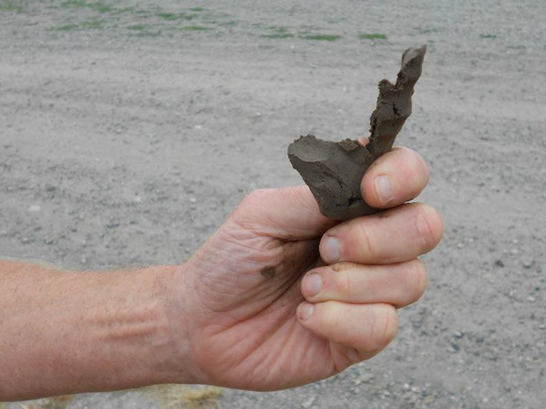
Clays and clay loams are very hard when dry, sticky when wet, and can be molded into wire and ribbon shapes when moist (Figure 2). They generally have high water-holding capacity and low permeability. To learn how to estimate the texture of soil, view the WSU Extension video, Determining Soil Texture by Hand (Cogger 2010b).
Soil texture is a fixed property and cannot be changed through management. But, soil of almost any texture can be suitable for gardening, as long as gardeners are aware of the soil’s limitations and adjust their management practices to compensate. Clay soils hold a lot of water, but are hard to dig and dry slowly in the spring. Sandy soils need more frequent watering and lighter, more frequent fertilization, but they can be planted earlier in the spring. Most soils can benefit from additions of organic matter (Cogger 2005), as described in this publication under the section Organic Amendments.
Many soils contain coarse fragments, that is, gravel and rocks. Coarse fragments do not contribute to a soil’s productivity and can be a nuisance when digging in the soil. However, gardeners should not feel compelled to remove all of them from their garden since coarse fragments are not harmful, and time is better spent on other gardening tasks. The only time rocks are a problem is when the soil is nothing but rocks. Then, water- and nutrient-holding capacities are so low that it is difficult to grow healthy plants. Raised beds are an alternative strategy for gardening in very rocky soils. For information on raised beds, refer to Washington State University Extension publication FS075E Raised Beds: Deciding If They Benefit Your Vegetable Garden (Cogger 2017).
Soil Structure
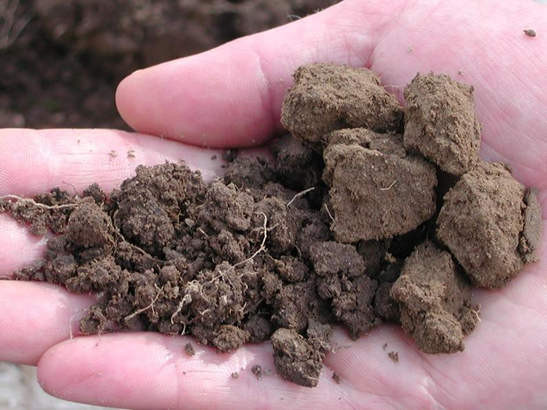
Individual particles of sand, silt, and clay bind together with organic matter, forming aggregates called peds, which provide structure to a soil. Dig up a piece of grass sod and examine the soil around the roots. The granules of soil clinging to the roots are examples of peds (Figure 3). Aggregation is a natural process caused largely by biological activity, such as earthworm burrowing, root growth, and microbial production of binding agents that strengthen the peds.
The spaces between peds are the soil’s macropores, which improve permeability, drainage, and oxygen levels in the soil profile. The pores within peds are predominantly micropores, which contribute to the soil’s water-holding capacity. A well- structured soil is like a sponge, allowing water to enter and soak into the micropores and letting excess water drain downward through the macropores. Good structure is especially important in medium- to fine-textured soils because it increases the soil’s macroporosity, thus improving permeability and drainage.
Compaction and Loss of Structure
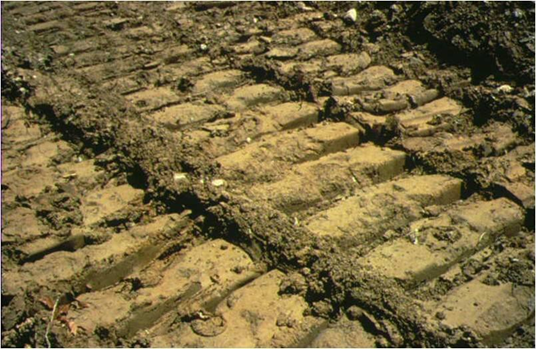
Soil structure is fragile and can be damaged or destroyed by compaction, excessive tillage, or tillage when the soil is too wet. Loss of organic matter also weakens soil structure. Compaction squeezes macropores into micropores and creates horizontal aggregates that resist root penetration and water movement (Figure 4).
Soil compaction occurs during land clearing, site preparation, construction, and utility work, creating a difficult environment for establishing plants. Cutting, levelling, and filling soils to shape sites for construction also degrade the rooting environment. The topsoil is removed or buried leaving a surface with little structure or organic matter. Cuts also reduce soil depth, while fills create layers that can restrict water movement. These problems are common in urban and suburban neighborhoods.
Structural damage caused by human activity usually is most severe within the top foot of soil and can be overcome by proper soil management. Adding organic amendments at the time of bed preparation and using organic surface mulches help restore soil structure. For more information see the section titled Organic Amendments in this publication.
In some soils, there is deeper compaction caused by pressure from ancient glaciers. Glacially compacted subsoils (a type of hardpan) are common in the Puget Sound area, where the compacted layer often begins 18 to 36 inches below the soil surface. The compacted layer may be much closer to the surface where the land surface has been shaped for development. This layer looks like concrete and is so dense and thick that it is nearly impossible to work with. If a garden has a glacially compacted layer close to the soil surface, consider using raised beds to increase soil depth.
Tilling a garden bed when soil is too wet also damages soil structure. If a handful of soil can be molded into a wire or worm shape, it is too wet to till. If the soil crumbles when you try to mold it, it is dry enough to till.
Organic Matter
Soil organic matter is a mixture of biological materials in varying states of decomposition in the soil. Fresh organic matter is decomposed by soil organisms, releasing nutrients, carbon dioxide, and energy, and is eventually transformed into more stable materials. Stabilized organic matter consists of complex molecules that decompose slowly, and contribute to soil structure, water holding capacity, and slow release of nutrients.
Adding organic amendments is the best way to improve the environment for most types of plants in most soils. Organic matter helps build and stabilize structure in fine-textured and compacted soils, thus improving permeability and aeration and reducing the risk of runoff and erosion. As microbes break down and stabilize fresh organic matter, they create natural glues that bind and strengthen soil aggregates. Organic matter also helps sandy soils hold water and nutrients.
Although organic matter improves soil physical properties and supplies nutrients, excessive application of organic matter can harm crops and increase the risk of environmental harm through nutrient loss. For more information, refer to the section Nutrient Excesses in this publication and to Oregon State University Extension publication EM 9165 Nutrient Management for Sustainable Vegetable Production Systems in Western Oregon (Sullivan et al. 2017).
Slope, Aspect, Depth, and Water
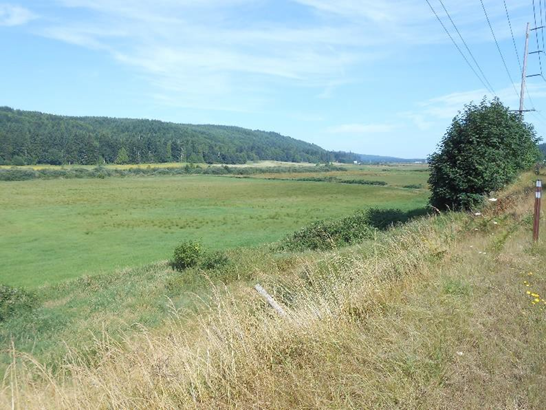
Slope, aspect (direction of exposure), and soil depth affect water availability. Choose plants that are best suited to a property’s specific conditions. Ridge tops and side slopes shed water, while soils at the bottom of slopes and in low areas collect water (Figure 5). Often, soils that collect water have high winter water tables, which can affect the health of some plants. Soils on ridge tops are more likely to be droughty. Site aspect is also important. South- and southwest-facing exposures collect the most heat and increase water demand by plants.
Soil depth affects water availability by defining the rooting zone. Soil depth is limited by compacted, cemented, or gravelly layers, or by bedrock. A shallow soil has less available water simply because the soil volume available to roots is smaller. The deeper one can dig before hitting a restrictive layer, the greater the soil volume for holding water.
Water Management in Your Garden
Soils and Irrigation
Most gardens in the Pacific Northwest require summer irrigation. The need for irrigation varies, depending on soil water-holding capacity, weather, site aspect, type of plants grown, and plant growth stage. Raised beds usually need more frequent irrigation than native soils. In most cases, the goal of irrigation is to recharge the available water in the top foot or so of soil. For sandy soil, one inch of irrigation water is all that is needed. Any more will leach (move downward) through the root zone, carrying away important nutrients with it. A silt loam or clay soil can hold more than two inches of water, but may need to be irrigated more slowly to prevent runoff.
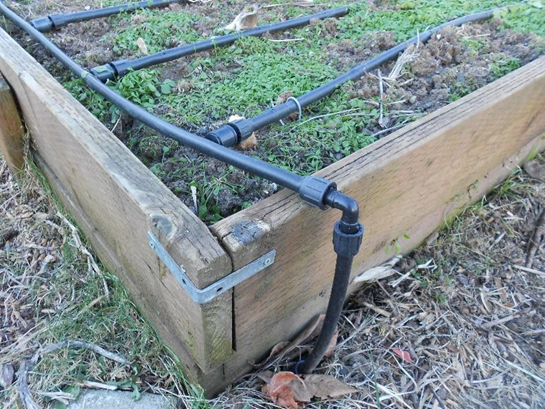
The two most common types of garden irrigation systems are sprinklers and drip systems. Movable sprinklers are less expensive, but also less efficient than drip irrigation. Drip irrigation uses tubing with emitters to direct water to a plant’s root zone (Figure 6). Installing a drip system takes an initial investment of money and effort, but results in long-term savings of both water and time. Designing and installing a drip system is simple enough that most gardeners can do it themselves. For more information on drip irrigation systems, refer to Washington State University Extension publication FS030E Drip Irrigation for the Yard and Garden (Peters 2011).
It is important to know how much water you are applying. For sprinkler systems, place some straight-sided cans around the sprinkler and measure how much water collects in each can over a set time. You can calculate water application in a drip system using the flow rating (gallons per hour) for the dripline, the length of dripline, and the area irrigated. Refer to drip irrigation suppliers and catalogs for flow information. Once you know how long it takes to deliver the desired amount of water, use an in-line timer to shut off the water when irrigation is complete.
When choosing an irrigation system, consider the trade-offs in efficiency, cost, complexity, and the time required to move hoses. Sprinkler irrigation or soaker hoses make sense in a temporary garden site or for just a few beds. Drip irrigation will save considerable time and water in larger permanent gardens and landscapes or with multiple beds.
Wet Soils
If soil stays wet in the spring, delay tilling and planting. Working wet soil can damage its structure, and seeds are less likely to germinate in cold, wet soil. Some plants do not grow well in wet soil. Raspberries, for example, often become infected with root diseases in wet soil and thus lose vigor and productivity. Soils may be wet because they are located in a low- lying area that collects runoff from surrounding areas. Soils on level ground may be wet if they have a compacted underlayer that restricts drainage through the soil profile. Either natural or human-caused compaction can restrict drainage.
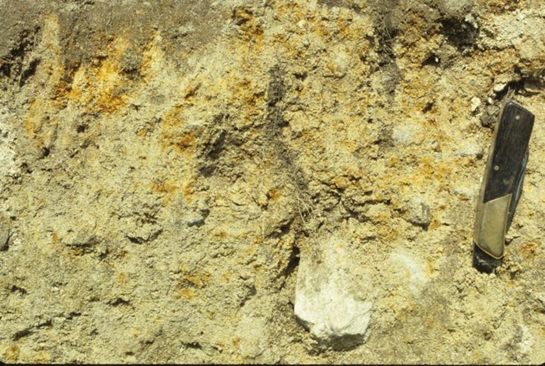
A soil’s color provides clues to its tendency to stay wet. If a subsoil is brown or reddish, the soil probably is well drained and has few wetness problems. Gray subsoils, especially those with brightly colored mottles, often are wet (Figure 7). If soil is gray and mottled directly beneath the topsoil, it is probably saturated during the wet season.
Sometimes, simple actions can reduce soil wetness problems. For example:
- Divert runoff from roof drains away from garden areas.
- Avoid plants that perform poorly in wet conditions.
- Use raised beds for perennials that require well-drained soil and for early-season vegetables.
A more complex and expensive action is installing subsurface drainage. First investigate whether a drain on a slope will remove excess water. Make sure there is a place to drain the water. Check with local regulatory agencies to determine whether there are restrictions on drainage projects.
Soil Life
Soil abounds with life. Besides plant roots, earthworms, insects, and other visible creatures, soil is home to an abundant and diverse population of microorganisms. A single gram of topsoil (about one-quarter teaspoon) can contain as many as a billion microorganisms (Table 1). Microorganisms are most abundant in the rhizosphere—the thin layer of soil surrounding plant roots.
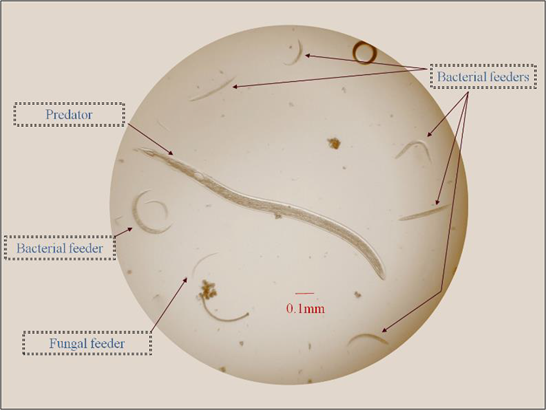
The primary function of soil organisms is to break down the remains of plants and other organisms. This process releases energy, nutrients, and carbon dioxide, and creates soil organic matter. Many types of organisms are involved, ranging from tiny bacteria to fungi, nematodes (Figure 8), insects, and earthworms.
Some soil organisms play other beneficial roles. Mycorrhizal fungi inoculate plant roots, resulting in an increase in their ability to take up nutrients (particularly phosphorus) and water from the soil. For more information on mycorrhizal fungi, refer to Washington State University Extension publication FS269E, A Gardener’s Primer to Mycorrhizae: Understanding How They Work and Learning How to Protect Them (Chalker-Scott 2017). Rhizobia and Frankia bacteria are responsible for converting atmospheric nitrogen to organic forms, a process known as nitrogen fixation. Earthworms mix large volumes of soil and create macropore channels that improve soil permeability and aeration. However, not all soil organisms are beneficial to garden plants. Some are pathogens, which cause diseases, such as root rot in raspberries and scab on potatoes. Moles can damage crops and lawns, and slugs are a serious pest in many Northwest gardens.
| Type of organism | Number per gram of soil (dry weight basis) |
|---|---|
| Bacteria | 100 million to 1 billion |
| Actinomycetes | 10 million to 100 million |
| Fungi | 100,000 to 1 million |
| Algae | 10,000 to 100,000 |
| Protozoa | 10,000 to 100,000 |
| Nematodes | 10 to 100 |
The activity of soil organisms depends on soil moisture and temperature, as well as on the soil’s organic matter content and organic inputs. Most microorganisms are most active between 70°F and 100°F, while earthworms are most active and abundant at about 50°F. Most organisms prefer moist soil. Because organic matter is at the base of the soil food web, soils with more organic matter tend to have more organisms.
The relationships between gardening practices, microbial populations, and soil health are complex and often poorly understood. However, almost all gardening activities—including tillage; the use of fertilizers, manures, and pesticides; and the choice of crop rotations—affect the population and diversity of soil organisms. For example, amending soils with organic matter, mulching, returning crop residues to the soil, reducing tillage, and rotating plantings tend to increase the number and diversity of beneficial organisms.
Soil Nutrients
Soil supplies 14 essential plant nutrients. Each nutrient plays one or more specific roles in plant growth. Nitrogen, for example, is a component of chlorophyll, amino acids, proteins, DNA, and many plant hormones. It plays a vital role in nearly all aspects of plant growth and development, and plants need a large amount of nitrogen to grow well. In contrast, plants need only a tiny amount of molybdenum, which is involved in the functioning of only a few plant enzymes. Molybdenum nonetheless is essential, and plant growth is disrupted if it is deficient. Plants also require carbon, hydrogen, and oxygen, which they derive from water and air.
A soil nutrient is classified as a major nutrient or micronutrient based on the amount plants need for health (Table 2a-b). If a soil’s nutrient supply is deficient, fertilizers can provide the additional nutrients needed for healthy plant growth.
| Major nutrients | Chemical symbol |
|---|---|
| Nitrogen | N |
| Phosphorus | P |
| Potassium | K |
| Sulfur | S |
| Calcium | Ca |
| Magnesium | Mg |
| Micronutrients | Chemical symbol |
|---|---|
| Zinc | Zn |
| Iron | Fe |
| Copper | Cu |
| Manganese | Mn |
| Boron | B |
| Molybdenum | Mo |
| Chlorine | Cl |
| Nickel | Ni |
Nutrient Deficiencies
The most common nutrient deficiencies found in soil are nitrogen (N), phosphorus (P), and potassium (K)—the nutrients that are in largest demand by plants. Sulfur deficiencies are also common in Washington soils. Nearly all soils lack enough available N for ideal plant growth, and phosphorus deficiencies occur in unfertilized soils. Potassium deficiencies are common west of the Cascades, but many soils east of the Cascades have adequate potassium for crop growth. Phosphorus accumulates in soils that have experienced repeated P fertilization, so gardens with a history of fertilization are seldom deficient in P.
Calcium and magnesium may be deficient in acid soils, which are typically found west of the Cascades. Except for boron and zinc, micronutrients are rarely deficient in soils in the Northwest. Boron deficiencies occur most often in soils west of the Cascades, particularly in root crops, brassica crops (for example, broccoli), and caneberries (for example, raspberries). Zinc deficiency is usually associated with high pH soils found east of the Cascades and most often affects tree fruits.
Each nutrient deficiency causes characteristic symptoms. In addition, affected plants grow more slowly, yield less, and are less healthy than plants with adequate levels of nutrients. For descriptions of nutrient deficiency symptoms, refer to Nutrient Management for Commercial Fruit & Vegetable Crops in Minnesota (Rosen and Eliason 2005) and Identifying Nutrient Deficiencies in Ornamental Plants (Shober and Denny 2017).
Nutrient Excesses
Excess nutrients can be a significant problem for plants and the environment. Excesses usually result because too much of a nutrient is applied to the soil or because a nutrient is applied at the wrong time. For example, applying too much nitrogen can lead to excessive foliage production, increasing the risk of plant disease and wind damage, and delaying flowering, fruiting, and dormancy. Available nitrogen left in the soil at the end of the growing season can leach into ground water and threaten drinking water quality. Excess phosphorus can harm water quality if it moves into streams and lakes through runoff and erosion. The key to applying fertilizers is to supply enough nutrient at the right time to meet plant needs without creating excesses that can harm plants or the environment.
Nutrient Availability to Plants
Plants can only take up nutrients that are in solution (dissolved in soil water). Most soil nutrients are not in solution; they are tied up in soil mineral and organic matter in insoluble forms. These nutrients become available to plants only after being converted to soluble forms and dissolving into soil water. This process occurs through weathering of mineral matter and biological decomposition of organic matter. Weathering of mineral matter slowly releases small amounts of nutrients into solution. Nutrient release from soil organic matter is somewhat faster and depends on the biological activity in the soil.
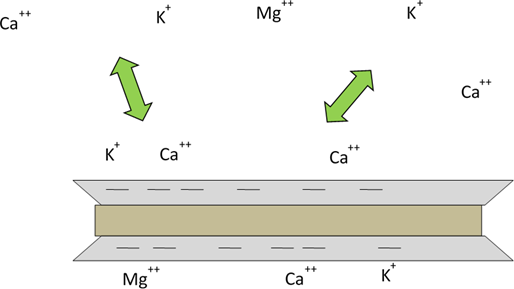
Nutrient release from soil organic matter is fastest in warm, moist soil and nearly nonexistent in cold or dry soil. Thus, the seasonal pattern of nutrient release is similar to the pattern of nutrient uptake by plants. Approximately one to four percent of the nutrients in soil organic matter are released in soluble form each year. Soluble, available nutrients are in ionic form. An ion has either a positive or negative electrical charge. Positively charged ions are called cations, and negatively charged ions are called anions. Potassium, calcium, and magnesium are examples of cations. Chloride is an example of an anion.
Clay particles and soil organic matter contain negative charges on their surfaces and thus can attract positive charges (cations) (Figure 9). They hold nutrient cations in a form that can be released rapidly into soil solution to replace nutrients taken up by plant roots. This reserve supply of nutrients contributes to soil fertility. A soil’s capacity to hold cations is called its cation exchange capacity or CEC. CEC is greater in soils with more clay or organic matter, and lower in sandy soils with little clay.
The Nitrogen Cycle
Managing nitrogen is a key part of growing a productive and environmentally friendly garden. Nitrogen is the nutrient needed in the largest amount by plants, but excess nitrogen can harm plants, degrade water quality, or lead to increased emissions of nitrous oxide (N2O), a greenhouse gas. Understanding how the nitrogen cycle affects nitrogen availability can help gardeners become better nutrient managers.
Nitrogen is found in four main forms in the soil (Table 3). Only two of the forms—ammonium and nitrate—can be used directly by most plants.
| Form of nitrogen | Characteristics |
|---|---|
| Organic N | Primary form of N in soil. Found in proteins, lignin, etc. Not generally available to plants. Mineralized to ammonium by soil microorganisms. |
| Ammonium(NH4+ ) | Inorganic, soluble form. Available to plants. Converted to nitrate by soil microorganisms. |
| Nitrate (NO3- ) | Inorganic, soluble form. Available to plants. Can be lost through leaching. Converted to gases in wet soils. |
| Atmospheric N (N2) | Makes up approximately 80 percent of the soil atmosphere. Source of nitrogen for nitrogen-fixing plants. Not available to other plants. |
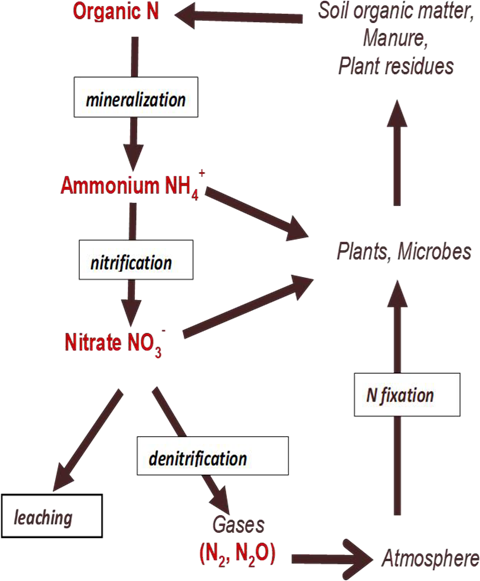
Most nitrogen in soil is found in the complex organic compounds that make up soil organic matter. This organic nitrogen is not available to plants. As soil warms in the spring, soil microbes begin breaking down organic matter to obtain energy, releasing some of the nitrogen as ammonium (NH4+) (Figure 10). Ammonium is a soluble ion that is available to plants and soil microbes. When the soil is warm, a group of microbes called nitrifiers use ammonium as an energy source converting it to nitrate (NO3–). Nitrate is also soluble and available to plants. The ammonium and nitrate ions released from soil organic matter are the same as the ammonium and nitrate contained in processed fertilizers.
Because nitrate has a negative charge, it is not held to the surface of clay or organic matter, so it can be lost readily by leaching. Nitrate remaining in the soil at the end of the growing season will leach out during the fall and winter and may reach groundwater, where it becomes a contaminant. Excess irrigation can leach nitrate during the growing season. In soils that are saturated and depleted of oxygen during the wet season, soil microbes convert nitrate into nitrogen gases through a biological process called denitrification. Ammonium and nitrate taken up by plants are converted back to organic forms in plant tissue. When plant residues are returned to the soil, they decompose, slowly releasing nitrogen back into plant-available forms.
The nitrogen cycle is a leaky one, with losses to leaching and to the atmosphere. Harvesting crops also removes nitrogen. To maintain an adequate nitrogen supply, nitrogen must be added back into the system through fixation or fertilization.
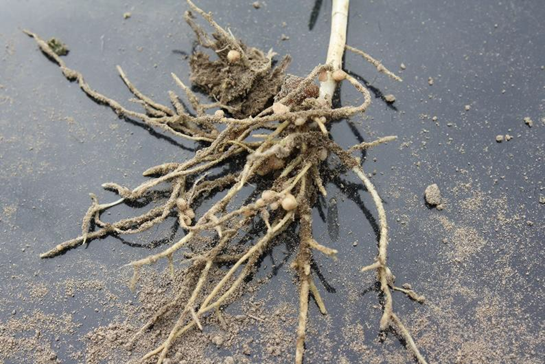
Nitrogen fixation (Figure 10) is a natural process involving certain plants and nitrogen-fixing bacteria, such as Rhizobia and Frankia. The bacteria form nodules in plant roots (Figure 11).
Through these nodules the bacteria are able to take atmospheric nitrogen (N2 gas) from the soil air, convert it to organic N, and supply it to the plant. The plants supply the bacteria with energy and nutrients. Legumes, such as peas, beans, clover, and Scotch broom fix nitrogen using Rhizobia. Alder trees fix nitrogen with Frankia. Growing legumes as a cover crop will supply nitrogen to the next season’s garden crops.
Phosphorus
Phosphorus has low solubility in soil water and thus low availability to plants. As a result, many soils without a history of fertilization are deficient in available phosphorus and need phosphorus fertilization to support fast-growing garden crops. Landscape shrubs and trees seldom need P fertilization, even in previously unfertilized soils. Many vegetable crops benefit from phosphorus as a starter fertilizer because it provides adequate P to young plants with small root systems. Repeated applications of phosphorus-containing fertilizers or organic amendments will increase P levels in the soil to the point that little or no additional P fertilizer is needed.
Excess phosphorus accumulation can become a serious environmental problem. Loss of excess P through runoff or erosion into lakes and streams can contribute to eutrophication (algae blooms that harm water quality and aquatic ecosystems). Soil testing is a valuable tool for determining if your plants need more phosphorus, or if you have an excess amount of P and need to adjust your fertility plan. See the Using Fertilizers: How Much, When, and How section in this publication for more information on soil testing.
Soil pH
Soil pH is a measure of the acidity or alkalinity of a soil. At a pH of 7 (neutral), acidity and alkalinity are balanced. Acidity increases by a factor of 10 with each one-unit drop in pH below 7. For example, a pH of 5.5 is ten times as acidic as a pH of 6.5.
Native soil pH depends on the minerals present in the soil and on the climate. Soils in arid locations tend to be alkaline, and those in rainy areas tend to be acid. Gardening practices also affect soil pH. For example, many nitrogen fertilizers reduce pH, while liming increases pH. Soil pH influences plant growth by affecting the availability of plant nutrients and toxic metals, and by affecting the activity of soil microorganisms, which in turn affects nutrient cycling and plant disease risk.
The availability of phosphorus decreases in acid soils, while the availability of iron increases. In alkaline soils, the availability of iron and zinc can be quite low, resulting in deficiencies in sensitive plants. Aluminum availability increases in acid soils. Aluminum is one of the most common elements in soil, but it is not a plant nutrient and is toxic to plants in high concentrations. Very little aluminum is in solution in soils above pH 6, so it does not cause problems for plants. However, as pH declines and aluminum availability increases, aluminum toxicity can become a problem.
Microbes are also affected by soil pH. The most numerous and diverse soil microbial populations exist in the middle of the pH range. Fewer organisms are adapted to strongly acid or strongly alkaline soils. Nutrient cycling is slower in strongly acid and strongly alkaline soils as a result of reduced microbial populations.
Most garden plants perform best in soil with a pH of 6 to 7.5, but some (such as blueberries and rhododendrons) are adapted to more strongly acid soils (pH 4.5 to 5.5). Before amending soil to adjust pH, it is important to know the preferred pH ranges of your plants.
Increasing Soil pH
Many western Washington soils are below the ideal pH level for growing vegetable crops. The most common way to increase soil pH is to add lime. Lime is ground limestone, a rock containing calcium carbonate. It is suitable for use by organic gardeners. Lime not only raises the pH of acid soils, it supplies calcium, an essential nutrient. Dolomitic lime contains magnesium as well as calcium and is a good choice for acid soils that are deficient in magnesium.
Lime is a slow-release material, so apply it in the fall to benefit spring crops. Finely ground lime works more quickly than coarser particles, but it can be dusty. Pelletized lime is more expensive than ground limestone, but many gardeners find it convenient to use.
The amount of lime needed depends on the initial and desired soil pH, soil texture, and organic matter. The best way to determine whether your soil needs lime and how much to apply is to have it tested (see the section in this publication Soil Tests and University Extension Publications for details). Do not lime areas where you grow acid-loving plants (such as blueberry and rhododendron).
Wood ashes are a readily available source of potassium, calcium, and magnesium. Like lime, they also raise soil pH. High rates of wood ash may cause short-term salt injury, so apply no more than 15 to 25 pounds per 1,000 square feet.
Gypsum (calcium sulfate) is not a substitute for lime. It supplies calcium and sulfur, but has little effect on soil pH. Gypsum has been promoted as a soil amendment to improve soil structure. In most cases, gypsum application does not change soil structure. Gypsum can improve soil structure when poor structure results from excess sodium in the soil, a rare condition in Northwest gardens. Use organic amendments to improve soil structure, as described under the Organic Amendments section in this publication.
Decreasing Soil pH
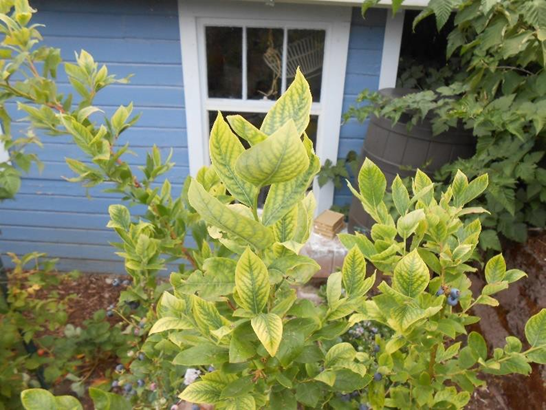
Soil pH east of the Cascades is often too high to grow healthy acid-loving plants, such as blueberries, rhododendrons, and maple trees. These plants can develop iron deficiency if the pH is too high (Figure 12). Even some soils west of the Cascades are not acidic enough for good blueberry production. Elemental sulfur lowers soil pH. The amount of sulfur needed depends on the soil’s original and desired soil pH and soil texture. Soil testing is the best way to determine whether sulfur is needed and, if so, how much. Applying too much sulfur can cause the pH to drop below desirable levels. Ammonium sulfate fertilizer lowers pH more gradually than sulfur does, and urea also reduces pH slowly, as do some organic fertilizers. Gypsum does not lower soil pH.
For specific guidelines on acidifying soils, see Oregon State University Extension publication EC 1560-E Acidifying Soils in Landscapes and Gardens East of the Cascades (Locke et al.
2006) or Oregon State University Extension publication EC 1560-E Acidifying Soils for Blueberries and Ornamental Plants in the Yard and Garden West of the Cascade Mountain Range in Oregon and Washington (Hart et al. 2003).
Soil Salinity
Soil salinity can be a problem, particularly in irrigated soils in arid areas of eastern Washington. Salts from irrigation water, fertilizer, compost, and manure applications can accumulate to the point where they harm plant growth. Seedlings and transplants are most susceptible to salt injury. In areas with more rainfall, salts are leached from the soil each winter and do not accumulate in the root zone.
An electrical conductivity (EC) test measures the level of soil salinity. Table 4 compares the relative susceptibility of typical garden vegetable crops to excess soluble salts. For more details, refer to Oregon State University Extension Service EM 9165 Nutrient Management for Sustainable Vegetable Cropping Systems in Western Oregon (Sullivan et al. 2017).
Salts can be leached from soil by applying irrigation water in excess of the water-holding capacity of the soil. The excess water must drain downward through the soil to carry away excess salts. When leaching, apply water slowly enough that it drains freely through the subsoil. Six inches of excess water removes about half of the soluble salts in a soil. A foot of water removes about 80 percent.
| Electrical conductivity 2 dS/m or mmhos/cm | Crop sensitivity 3 |
|---|---|
| 1–2 | Turnip, Carrot, Bean, Pea, Radish, Onion, Lettuce, Pepper |
| 2–4 | Potato, Sweet Corn, Celery, Cabbage, Spinach, Tomato, Cucumber, Broccoli |
| 4–6 | Beet, Zucchini |
1 Adapted from Oregon State University EM 9165, Sullivan et al., 2017.
2 Measured by saturated paste method. EC measured in a 1:2 soil:water suspension is approximately half of the saturated paste value. Check your lab report to see which method was used.
3 Plant injury and yield reduction of 10% or more possible in this EC range.
Organic Amendments
The best use of specific organic materials varies, depending on their nitrogen concentration. Organic materials that contain > 3% total N are rich in nitrogen and are used as organic fertilizers. Examples include poultry manure, feather meal, and fish meal. These materials are a good source of nutrients, but must be used sparingly to avoid overfertilization. Refer to the Using Fertilizers: How Much, When, and How section in this publication to determine how much and when to apply these fertilizers.
Organic materials with intermediate levels of nitrogen (including many composts, leaf mulches, and cover crop residues) have lower nutrient availability and make good organic amendments. They can be added to the soil in large amounts to replenish soil organic matter. Organic matter builds and stabilizes soil structure, thus reducing erosion and improving soil porosity, infiltration, and drainage, while also effectively holding water and nutrients for plants and soil organisms.
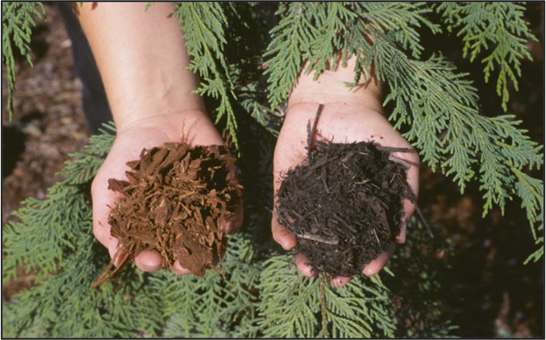
Materials with low nitrogen concentrations (< 1 to 1.5% total N), such as straw, bark, and sawdust (Figure 13), contain so little nitrogen that they reduce levels of available nitrogen when mixed into the soil. Soil microorganisms use available nitrogen when they break down these materials, leaving little nitrogen for plants. This process is called immobilization and results in nitrogen deficiency. These materials are suitable as organic mulches applied to the soil surface. They do not cause nitrogen immobilization as long as they remain on the surface and are not mixed into the soil.
Compost
Compost is an excellent source of organic matter for garden soils. Composting also closes the recycling loop by turning waste materials into a soil amendment. Gardeners can make compost at home or buy commercially prepared compost. For more information on home composting of yard debris and vegetable scraps, refer to WSU Extension publication EB1784E Backyard Composting (Cogger et al. 2017).
Commercial Compost
Many gardeners prefer to use commercial compost or will supplement their home compost with commercial compost. Yard debris (from curbside pickup or landscaper drop off) is the major raw material (feedstock) in most commercial compost sold in Washington. Feedstocks for commercial compost also may include home and commercial food waste, animal manure, biosolids, crop residues, or wood waste. Commercial compost is made on a large scale, with frequent aeration or turning to create conditions that kill weed seeds, plant pathogens, and human pathogens. Commercial compost is cured and screened to make a product that is uniform and convenient to use.
Using Compost
Add one to three inches of compost to build soil organic matter when establishing a new garden or landscape bed, For an established garden bed, add about one-half inch of compost each year. If soil testing shows very high levels of phosphorus, stop adding compost and grow cover crops instead. Till or dig compost directly into garden soil, or use it as mulch before turning it into the soil. When establishing landscape beds, either incorporate the compost before planting or leave it on the surface. One cubic yard of compost covers approximately 300 square feet of soil at a depth of one inch. For more information on how much compost to apply, refer to WSU Extension publication FS123E Organic Soil Amendments in Yards and Gardens: How Much Is Enough? (Cogger and Stahnke 2019).
In the first or second year after application, partially decomposed woody compost may immobilize some soil nitrogen, resulting in nitrogen deficiency for plants. If plants show signs of nitrogen deficiency (for example, poor growth or yellow leaves), add extra nitrogen fertilizer (either organic or inorganic). In following years, most composts contribute small amounts of available nitrogen to the soil. Composts also supply P, K, and micronutrients.
When gardening in arid locations, be aware that some composts may increase the salinity of the soil. Yard-debris composts generally contain few salts, but manure-based composts may contain enough salts to be harmful. If there are problems with salinity in the garden soil, reduce or avoid the use of manure composts.
Green Manure (Cover Crops)
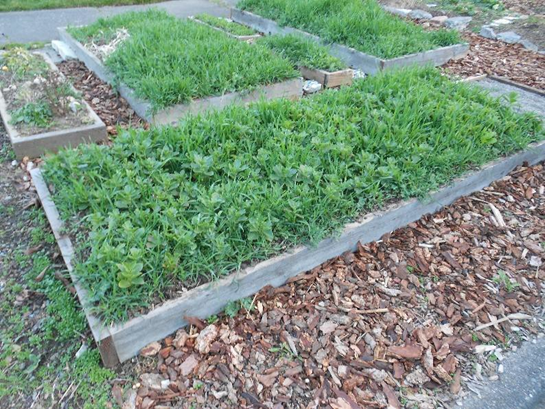
Green manures are cover crops specifically grown to be tilled or dug into the soil, or left on the soil surface as mulch. Planting green manure is a way for gardeners to grow their own organic matter (Figure 14). However, the value of cover crops goes beyond their contribution of organic matter. These crops are also able to:
- Capture and recycle nutrients that otherwise would be lost by leaching during the winter,
- Protect the soil surface from the impact of rainfall,
- Reduce runoff and erosion,
- Suppress weeds, and
- Supply additional nitrogen (legumes only).
However, no one cover crop provides all of these benefits. Deciding which cover crop or crop combination to grow depends on which benefits are most desired and which cover crops best fit into the overall garden plan (Table 5). With the exception of buckwheat, all of the cover crops listed in Table 5 are suitable for fall planting and spring termination. For more information on cover crops, including seeding rates, planting dates, and uses, refer to WSU Extension publication FS111E Cover Crops for Home Gardens West of the Cascades (Cogger et al. 2014b) or WSU Extension publication FS117E Cover Crops for Home Gardens East of the Cascades (Cogger et al. 2014a).
Gardeners usually plant cover crops in the fall and terminate them by tilling or cutting them before spring planting begins. The earlier cover crops are planted, the more benefits they provide. Legumes such as vetch and crimson clover need an early start (September planting) to achieve enough growth to cover the soil before cold weather arrives. Cereal rye can be planted into October.
If a garden has crops still growing into November or December, it will not be possible to plant early cover crops over the entire area. In this case, plant cover crops in areas that are harvested early, and use mulch in those areas that are harvested later. For example, plant a cover crop in a sweet corn bed immediately following harvest in September, and mulch a bed of fall greens after removing the crop in November. Gardeners can also seed cover crops between rows of late crops if space allows.
Till or dig cover crops into the soil before they flower and go to seed. After flowering, plants become woody and decline in quality. Cover crops that set seed can turn into weeds when the seeds germinate. If a cover crop grows too large to till or dig into the soil, cut it off and leave it on the soil surface as mulch or compost it for later use. This will retain the short-term benefit of organic matter from the crowns and roots and from the decomposing mulch.
The benefits of organic matter derived from cover crops last only about one year, so make cover crops an annual part of crop rotation. If cover crops do not fit into an overall garden plan, winter mulches can be used as a substitute. Refer to WSU Extension publication FS119E Methods for Successful Cover Crop Management in Your Home Garden (Benedict et al. 2014) for more information on methods of planting and terminating cover crops.
| Cover crop | Type | Characteristics |
|---|---|---|
| Annual ryegrass | Grass | Hardy, tolerates wet soils in winter, difficult to till once established |
| Austrian winter pea | Legume | Fixes nitrogen, does not compete well with winter |
| Barley | Cereal | Not as hardy as rye, tolerates drought, leafy growth in spring |
| Buckwheat | Broadleaf | Fast-growing, frost-sensitive, summer cover |
| Cereal rye | Cereal | Very hardy, grows quickly, OK for late planting, matures |
| Common vetch | Legume | Fixes nitrogen, similar to hairy vetch, but easier to till in spring |
| Crimson clover | Legume | Fixes nitrogen, less biomass than vetches, easy to dig or |
| Fava bean | Legume | Fixes nitrogen, not as winter hardy as vetches |
| Hairy vetch | Legume | Fixes nitrogen, starts slowly, grows quickly in spring, good companion crop for cereal |
| Oats | Cereal | Not as winter hardy as other cereals, leafy, tolerates wet soils |
| Triticale | Cereal | Hardy cross between rye and wheat, leafy |
| Winter wheat | Cereal | Hardy, leafy |
Organic Mulch
Some organic materials can be effective mulches. Mulches are applied to the surface of the soil to reduce the loss of water through evaporation, protect the soil surface from erosion, reduce compaction, smother annual weeds, and modify the temperature of the soil. In annual gardens, mulches can be applied after harvest to protect the soil from erosion during the winter, or they can be applied between rows during the growing season to conserve water and reduce weeds. A thin layer of mulch will conserve water, but at least three inches of mulch are needed to smother weeds. Mulches are less effective against perennial weeds, such as horsetail and quackgrass. Straw, leaves, cover crop residues, and compost are effective annual mulches. Since straw and leaves are nitrogen-poor, gardeners may need to add extra N if they dig these mulches into the soil.
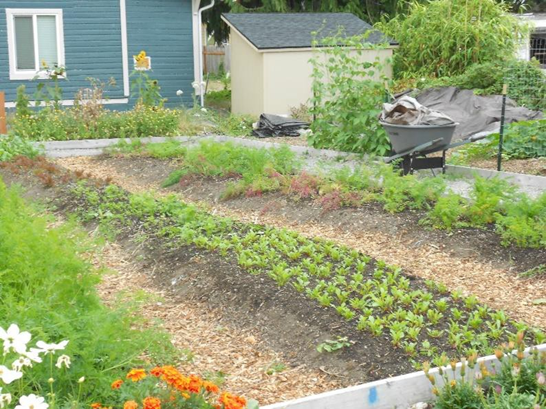
Materials such as wood chips, arborist chips, and bark resist decay, so they make effective, long-lasting mulches for permanent landscape beds (Figure 15). As long as these mulches remain on the soil surface, they have little effect on available nutrients in the underlying soil. However, incorporating them into the soil can reduce nitrogen availability for a year or more.
Fertilizers and Nutrient Management
Comparing Organic and Processed Fertilizers
Fertilizers supplement a soil’s native nutrient supply. They are essential to good plant growth when the soil nutrient supply is inadequate. Rapidly growing plants, such as annual vegetable crops, generally need more nutrients than slowly growing plants, such as established perennials. Processed fertilizers, organic fertilizers, or a combination of the two can supply soil nutrients.
Processed fertilizers are manufactured or refined from natural ingredients to make them more concentrated. Also, they are typically processed into soluble, ionic forms that are immediately available to plants. Some processed fertilizers are manufactured to mimic the slow nutrient release of organic fertilizers. Examples include specialty slow-release fertilizers for lawns and potted plants.
Organic fertilizers are natural materials that have undergone little or no processing. They include both biological (plant and animal) and mineral materials (Table 6). Once in the soil, organic fertilizers release nutrients through natural processes, including biological breakdown of organic matter and chemical weathering of mineral materials. The released nutrients are available to plants in water-soluble forms. These water-soluble nutrients are the same as those supplied by processed fertilizers.
When compared with processed fertilizers, organic fertilizers usually have a lower concentration of nutrients and release nutrients more slowly. Thus, larger amounts of organic fertilizers are needed, but their effects last longer.
Using organic fertilizers recycles materials that otherwise would be discarded as waste products. Production of processed fertilizers, on the other hand, can create waste products and use substantial amounts of energy. Most organic fertilizers also supply organic matter to soil, which can improve soil physical properties and long-term nutrient release. Although the amount of organic matter applied through organic fertilizers is small compared to composts or cover crops, organic fertilizers can still improve soil health.
Choosing organic fertilizers involves trade-offs in cost or convenience. Farmyard manure is usually inexpensive or free but can be inconvenient to transport, store, and apply. Packaged organic blends, on the other hand, are convenient but often expensive.
Nutrient Release
Nutrients in most processed fertilizers are available immediately. Processed fertilizers can furnish nutrients to plants in the spring before the soil is warm. However, nitrogen in these fertilizers is vulnerable to leaching loss from heavy rainfall or irrigation. Once nitrogen moves below the root zone, plants can no longer use it, and it may leach into groundwater.
Organic fertilizers are slow-release fertilizers because their nutrients become available to plants over the course of the growing season. The rate of nutrient release from organic materials depends on the activity of soil microorganisms, just as it does for nutrient release from soil organic matter. Temperature and moisture conditions that favor plant growth also favor the release of nutrients from organic matter.
Some organic fertilizers contain immediately available nutrients, as well as slow-release nutrients. These fertilizers can supply nutrients to plants both early in the season and later on. Poultry manure and fish emulsion are examples of organic fertilizers containing immediately available nutrients.
Some material in organic fertilizers breaks down so slowly that it is not available the first season after application. Repeated application of organic fertilizers builds up a pool of material that releases nutrients very slowly, similar to soil organic matter. In the long run, this nutrient supply decreases the need for supplemental fertilizer.
Fertilizer Labels
The labels on fertilizer packages show the amount of the three primary nutrients contained in the fertilizer, expressed as a percent of total fertilizer weight. Nitrogen (N) is always listed first, phosphorus (P) second, and potassium (K) third.
| Characteristic | Organic Fertilizers | Processed Fertilizers |
|---|---|---|
| Source | Natural materials, little or no processing. | Manufactured or extracted from natural materials; often undergo extensive processing. |
| Examples | Manure, alfalfa meal, fish meal, compost | Ammonium sulfate, potassium chloride, urea |
| Nutrient Availability | Usually slow release. Nutrients are released by biological and chemical processes in the soil. | Usually immediately available to plants. Some are slow- release, mimicking organic fertilizers. |
| Available Nutrient Concentration | Low to medium | Usually high |
Historically, the amount of phosphorus in fertilizer has been expressed not as P, but as units of phosphate (P2O5). Similarly, fertilizer potassium is expressed as potash (K2O). This practice is still used for fertilizer labels and recommendations, even though there is no practical reason for the system, except that people are accustomed to it. (If there is a need to convert from P to P2O5, the conversion is 1 lb P = 2.3 lb P2O5. For potassium, the conversion is 1 lb K = 1.2 lb K2O.)
Thus, a bag of fertilizer labeled 12-4-8 contains 12 percent nitrogen, 4 percent phosphorus expressed as P2O5, and 8 percent potassium expressed as K2O. This information on chemical content is called a fertilizer analysis. The analysis for processed fertilizers guarantees the amount of available nutrients in the fertilizer, whereas the analysis for organic fertilizers represents the total amount of nutrients, rather than the amount of available nutrients. Because nutrients in most organic fertilizers are released slowly, the amount of immediately available nutrients is less than the total amount.
Common Processed Fertilizers
Nitrogen
The raw material for processed nitrogen fertilizer is nitrogen gas from the atmosphere. The manufacturing process is the chemical equivalent of biological nitrogen fixation and requires a substantial amount of fossil fuel (natural gas) energy. Examples of processed nitrogen fertilizers available for home garden use are listed in Table 7.
| Material | Analysis | Comments |
|---|---|---|
| Urea | 46-0-0 | Rapidly converted to ammonium in soil |
| Ammonium sulfate | 21-0-0 | Also contains 24% available sulfur |
| Monoammonium phosphate | 11-52-0 | Used in mixed fertilizers as a source of N and P |
| Polymer-coated urea | 35-0-0 | Polymer coating slows release of available N |
Phosphorus and Potassium
Processed phosphorus fertilizers come from phosphate rock. The rock is treated with acid to release phosphorus into plant- available forms. The most common raw material for potassium fertilizers is sylvinite, a mixture of sodium chloride and potassium chloride salts. Sylvinite is mined and then treated to remove the sodium salts to make it suitable for use as a fertilizer. Some other potassium fertilizers are potassium sulfate salts, which supply sulfur as well as potassium. Table 8 lists examples of processed phosphorus and potassium fertilizers.
| Material | Analysis | Comments |
|---|---|---|
| Triple superphosphate | 0-46-0 | Available in small bags for gardeners |
| Monoammonium phosphate | 11-52-0 | Used in mixed fertilizers as a source of N and P |
| Ammonium polyphosphate | 10-34-0 | Used in liquid fertilizers as a source of N and P |
| Potassium chloride | 0-0-60 | N/A |
| Potassium sulfate | 0-0-50 | Also contains 18% sulfur |
Mixed Fertilizers
Mixed fertilizers often contain all three primary nutrients, although the ratios can vary. Fertilizers for annual gardens typically have N:P2O5:K2O ratios in the range of 1:1:1 or 2:1:1, such as 8-8-8 and 10-5-5 blends. Lawn fertilizers are higher in nitrogen; an example is a 21-4-4 blend. Some mixed fertilizers contain only N and K, for use on lawns and gardens that have adequate to excessive levels of soil P.
Common Organic Types of Fertilizers
Commercial Organic Fertilizers
Many organic by-products and some unprocessed minerals are sold as organic fertilizers. Table 9 shows the approximate nutrient content of some of these materials. Because most of these materials are slow-release fertilizers, not all of the nutrients are available in the year they are applied. Table 10 shows general estimates of first-year nitrogen availability in organic materials, based on nitrogen concentration.
Many organic fertilizer materials are rich in one primary nutrient (Table 9). The other nutrients are present in smaller amounts. Some companies blend organic ingredients into fertilizers that provide all of the primary nutrients in balanced proportions. Use balanced fertilizers or fertilizers rich in P or K if those nutrients are deficient. If the soil has adequate levels of P and K, use N- rich organic fertilizers or supply N with legume cover crops.
Commercial organic fertilizers tend to be more expensive per pound of nutrients than either processed fertilizers or manures. Sometimes the difference in price is substantial. Nevertheless, many gardeners prefer these products because they are easy to use. They are most economical for small gardens where little fertilizer is needed. The cost-per-pound of nutrients in organic fertilizers varies widely, depending on the type of material, the concentration of nutrients, and the package size. Compare costs and nutrient availability when shopping for organic fertilizers.
Animal Manure
Farmyard manure can be an inexpensive source of nutrients. If gardeners or their neighbors have livestock, it makes environmental and economic sense to recycle the livestock manure as fertilizer. Packaged manure products cost more than manure off the farm, but they are usually more uniform and convenient to handle.
Table 11 shows average nutrient concentrations and typical nitrogen availability for several types of animal manure. For information on other types of manure and bulk organic amendments, refer to Pacific Northwest Extension publication PNW533 Fertilizing with Manure and Other Organic Amendments (Bary et al. 2016).
Keep in mind that animal manures vary widely in nutrient content and nutrient availability, depending on the type of animal that produced the manure and the age and handling of the manure. For example:
- Manure mixed with straw or woody bedding has fewer nutrients than manure alone.
- Manure exposed to rain retains fewer nutrients because of leaching.
- Manure composted under cover retains more nitrogen, but reduces N availability.
| Material | Nitrogen % | P2O5 % | K2O % | Available N (% of total N) |
|---|---|---|---|---|
| Blood Meal | 12–15 | 1 | 1 | 75–100 |
| Feather Meal | 11–14 | 0 | 0 | 75–100 |
| Fish Meal | 10 | 4-6 | 2 | 75–100 |
| Canola Meal | 5–6 | 1-2 | 1 | 40–60 |
| Cottonseed Meal | 5–6 | 1-2 | 1 | 40–60 |
| Crab Shell Meal | 4 | 1.5 | 0 | 40–60 |
| Fish Emulsion | 3–5 | 1–2 | 1–2 | 75–100 |
| Alfalfa Meal | 2–3 | 0.5 | 1–2 | 15–30 |
| Bone Meal | 1–4 | 12–24 | 0 | N/A |
| Rock Phosphate2 | 0 | 25–30 | 0 | N/A |
| Greensand2 | 0 | 0 | 3–7 | N/A |
1 Adapted from Bary et al. (2016).
2 Very low nutrient availability. Other P and K sources are recommended.
N/A = not available.
| Total N concentration (% of amendment dry weight) | N availability during growing season (% of total N) |
|---|---|
| 1 | 0 |
| 2 | 15 |
| 4 | 45 |
| 6+ | 75 |
1 Based on data from Gale et al. (2006).
| Type | N (lb/cubic yard, as-is 3) | P2O5 (lb/cubic yard, as-is 3) | K2O (lb/cubic yard, as-is 3) | Moisture (%) | Weight (lb/cubic yard) | Available N (% of total N) |
|---|---|---|---|---|---|---|
| Chicken with litter | 24 | 26 | 20 | 30 | 850 | 40–60 |
| Rabbit | 14 | 18 | 10 | 65 | 1400 | 20–40 |
| Sheep | 12 | 11 | 13 | 70 | 1400 | 20–40 |
| Horse with bedding (moist) | 7 | 5 | 8 | 70 | 1400 | -5–10 4 |
| Separated dairy manure solids | 3 | 1 | 2 | 80 | 1100 | -5–10 4 |
1 Divide these numbers by 40 to estimate the nutrients in a five-gallon bucket of manure.
2 Data are from Gale et al. (2006) and Bary et al. (2016).
3 “As-is” is typical moisture and nutrient content for manure stored under cover. Manure can vary widely in moisture content, density, and nutrient concentrations, depending on how it is handled.
4 Negative value indicates N immobilization or conversion from available to unavailable form.
It does not take much nutrient-rich manure, such as poultry broiler litter, to fertilize a garden. A five-gallon bucket of broiler litter contains enough nutrients to fertilize 100 to 150 square feet of vegetable garden. A similar amount of rabbit manure will fertilize 20 to 30 square feet of garden. If more is applied, there is a risk of harming crops and leaching nitrogen into groundwater. Other manures, such as separated dairy solids and horse manure with bedding, contain few available nutrients and can be applied in larger amounts as soil amendments. As much as an inch of these materials can be used in a garden. It is best to use these manures mainly as a source of organic matter.
To fine-tune a manure application rate, experiment with the amount applied and observe its effect on crop performance. It is better to be conservative initially and add more nutrients later if crops seem deficient, rather than applying too much at the start. Apply manure evenly over annual beds, or between rows of perennial crops. Digging or tilling manure into the soil reduces the risk of nutrient loss and harm from runoff.
Timing Manure Applications
From a nutrient management standpoint, the best time to apply manure is in the spring before planting. Manure can also be applied in the fall, but some of the nutrients may be lost during the winter, especially west of the Cascades. Environmental risks of leaching and runoff also increase in winter. If manure is applied in the fall, apply it no later than mid-September. Immediately plant a vigorous non-legume cover crop, such as cereal rye, to capture nutrients and prevent runoff. See the Green Manure (Cover Crops) section in this publication for more information on cover crops. Also keep in mind that food safety considerations affect timing and crop choice for applications of uncomposted manure (see the Using Manure Safely sidebar).
Biosolids
Biosolids are a product of municipal wastewater treatment. Federal organic standards do not include biosolids as an organic fertilizer; however, biosolids do have two important characteristics of organic fertilizers and soil amendments: (1) their nutrients are released slowly from the organic form by natural processes in the soil and (2) they are a product of the waste stream that can benefit crop growth. Most of the biosolids produced in Washington are used to fertilize agricultural and forest crops.
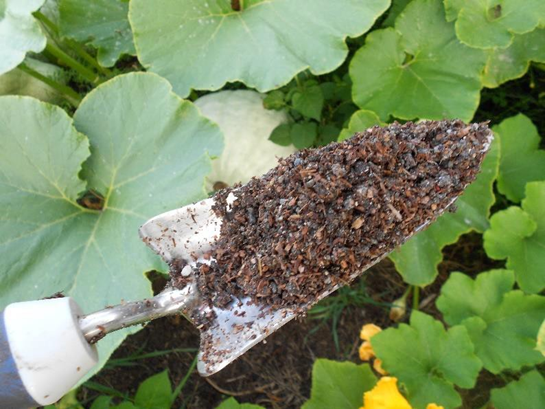
Some communities in Washington produce a special class of biosolids and market them to gardeners (Figure 16). These are called Class A biosolids and are a source of N, P, and micronutrients. They have been treated using heat or composting to reduce pathogens to background levels, making them safe for all garden uses. Three types of Class A biosolids are available in Washington as composts, blends, and heat-dried pellets.
Biosolids composts are made from biosolids and yard debris or woody materials and can be used similarly to other composts. Biosolids blends are formulated for different uses, including turf topdressing, mulches, and soil amendments. Heat-dried pellets are rich in nutrients and are used similarly to commercial organic fertilizers. Check with local wastewater treatment plants to see if they have Class A biosolids available for home use. For more information on biosolids, refer to Washington State University Extension publication FS156E Using Biosolids in Gardens and Landscapes (Cogger 2019a) and Pacific Northwest publication PNW 508 Fertilizing with Biosolids (Sullivan et al. 2015).
Using Manure Safely
Fresh manure may contain disease-causing pathogens that can contaminate garden produce. Salmonella and E. coli O157:H7 bacteria are among the most serious pathogens found in animal manure. Manure from dogs, cats, and other carnivores can contain helminths, which are worm-like parasites.
These pathogens are not taken up into plant tissue, but they can adhere to soil on plant roots or to the leaves or fruit of low- growing crops. The risk of infection is greatest from crops eaten raw, especially where the edible part is close to the soil (for example, carrots, radishes, salad greens, and strawberries). The risk is negligible if crops are thoroughly cooked. Composting manure at high temperatures kills pathogens, but it is very hard to maintain rigorous composting conditions in a backyard compost pile. Commercial manure composts are composted under controlled conditions to destroy pathogens. Bacterial pathogens die naturally over a period of weeks or months, so well-aged (one year or more) manure should not contain them. However, helminths in dog or cat manure can persist for years, so they should not be added to gardens or compost piles.
Using Fertilizers: How Much, When, and How
The goal of applying fertilizer is to supply enough nutrients to meet plant needs without accumulating excess nutrients in the soil that could leach into groundwater or run off into surface water. Soil tests and information contained in university Extension publications are two standard tools for estimating fertilizer needs.
Soil Tests and University Extension Publications
A soil test provides information on the amount of nutrients in a soil sample and recommends the amount of fertilizer that should be added based on the test results and the types of plants grown. Soil need not be tested every year; every two to four years is often enough. A basic garden soil test typically includes testing for soil pH and lime requirement, as well as for phosphorus, potassium, calcium, magnesium, and sometimes boron. In arid locations, the basic soil test also includes testing for electrical conductivity, a measure of soluble salts.
Although some soil-testing labs test for nitrate-N, these numbers are seldom useful for predicting crop N requirements, because nitrate levels can change rapidly due to plant uptake, leaching, and microbial activity. There is no rapid and reliable test that can predict nitrogen availability during the coming growing season. However, testing labs will provide a general nitrogen recommendation based on the type of plants grown and on any pertinent information about the soil (for example, whether there is a history of manure applications, which would increase the soil nitrogen supply). Washington State University, Oregon State University, and Pacific Northwest Extension publications are a good source of information on crop-specific nitrogen requirements.
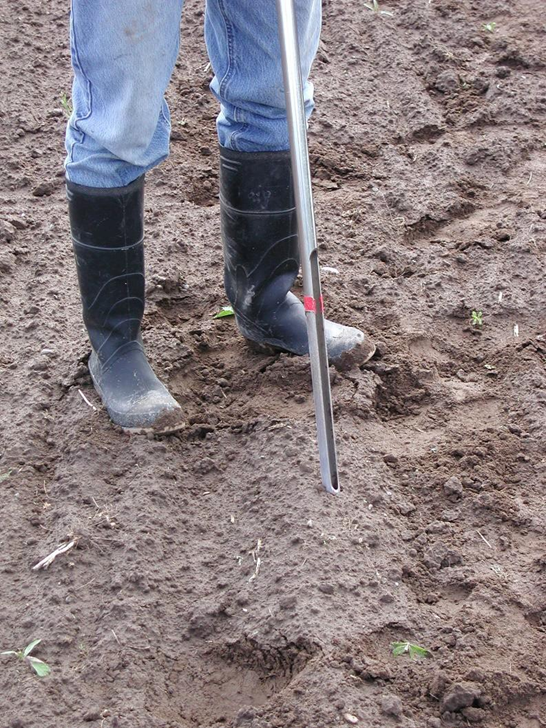
To obtain a soil sample, first collect subsamples from at least ten different garden locations. Avoid any atypical areas, such as the site of an old trash dump, burn pile, or rabbit hutch. Sample the top foot of soil (from the soil surface to a 12-inch depth). If the soil is too rocky to get a full 12-inch sample, then sample as deep as possible. Air-dry the samples and mix them together well. Send approximately one cup of the mixed sample to the soil-testing lab. The easiest way to collect samples is with a soil probe (Figure 17), but a trowel or spade can also be used. Because management and fertilizer recommendations vary for different crops, such as vegetables, lawns, and berries, collect separate samples for each area. View the WSU video How to Take a Soil Sample (Cogger 2010a) for a demonstration of sample collection, or refer to Oregon State University Extension Service publication EC 628 A Guide to Collecting Soil Samples for Farms and Gardens (Fery et al. 2018).
Washington State University does not test soils but maintains a list of laboratories that do agricultural and garden soil analyses in the Pacific Northwest (Washington State Pest Management Resource Service). Also, WSU Extension county offices often have lists of analytical labs that are popular locally. Before choosing a lab, make sure they specifically test and make recommendations for garden soils.
Find out if the lab:
- Routinely tests garden soils for plant nutrients and pH,
- Uses WSU or OSU test methods and fertilizer guides, and
- Provides recommendations for garden fertilizer applications. Also find out:
- What paperwork needs to accompany the soil sample,
- How much the test will cost, and
- How quickly the test results will be available.
Additional information on fertilizer rates, placement, and timing can be found in university Extension publications, such as those available from Washington State University and Oregon State University. These publications usually offer recommendations for processed fertilizers, but some provide guidelines for organic fertilizers as well. Refer to Oregon State University Extension publication EC 1478 Soil Test Interpretation Guide (Horneck et al. 2011) for background on interpreting soil test results.
Range of Nutrient Recommendations from Soil Tests and Extension Publications
Nitrogen recommendations for most vegetable garden crops are in the range of 2 to 2.5 lb of available nitrogen per 1,000 square feet of garden space (3 to 4 oz/100 square feet). Plants with high nitrogen demand, such as broccoli, sweet corn, and potatoes, need 3 to 4 lb of nitrogen per 1,000 square feet. Phosphorus rates vary from none to 2 lb of P2O5 per 1,000 square feet of garden space, depending on soil-test recommendations, while potassium rates typically vary from none to 4 lb of K2O per 1,000 square feet. General nitrogen recommendations for landscape trees and shrubs range from 1 to 2 lb N per 1,000 square feet of root zone. Recommendations for lawns range from 2 to 4 lb N per 1,000 square feet, along with 0 to 1 lb P2O5, and 0 to 2.5 lb K, depending on soil test results.
Calculating How Much Fertilizer to Apply
| Available N in fertilizer (%) | 0.2 oz N (lb fertilizer) | 0.5 oz N (lb fertilizer) | 1 oz N (lb fertilizer) | 2 oz N (lb fertilizer) | 4 oz N (lb fertilizer) |
|---|---|---|---|---|---|
| 0.5 | 2.5 | 6.0 | 13.0 | 25.0 | 50.0 |
| 1.0 | 1.3 | 3.0 | 6.3 | 13.0 | 25.0 |
| 2.0 | 0.6 | 1.6 | 3.0 | 6.0 | 13.0 |
| 4.0 | 0.3 | 0.8 | 1.6 | 3.0 | 6.0 |
| 6.0 | 0.2 | 0.5 | 0.8 | 1.6 | 3.0 |
| 8.0 | 0.16 | 0.4 | 0.6 | 1.3 | 2.5 |
| 10.0 | 0.13 | 0.3 | 0.5 | 1.0 | 2.0 |
| 15.0 | 0.08 | 0.2 | 0.4 | 0.8 | 1.7 |
| 20.0 | 0.06 | 0.16 | 0.3 | 0.6 | 1.3 |
| 30.0 | 0.04 | 0.1 | 0.2 | 0.4 | 0.8 |
When to Apply Fertilizer
In most cases, the best time to apply fertilizer is close to the time when plants need the nutrients. This timing reduces the potential for nutrients to be lost before they are taken up by plants. Nutrient loss is not only inefficient, but may contaminate groundwater or surface water. Plants need the largest amount of nutrients when they are growing most rapidly. Rapid growth occurs in midsummer for corn and squash, but earlier for spring plantings of lettuce and other greens. Plants also need a small amount of available nutrients shortly after seeding or transplanting.
For a long-season crop such as corn, many gardeners apply a small amount of fertilizer as a starter at the time of seeding and then add a larger amount in early summer, just before the period of rapid growth. When using slow-release organic fertilizers, a single preplant application is usually adequate.
For perennial plants, timing depends on the plant’s growth cycle. Table 13 gives examples of recommended fertilizer application times for several perennial food crops typically grown in home gardens.
Example 1. Processed Fertilizer Calculation:
A recommendation calls for adding 3 lb of N, 1 lb P2O5, and 2 lb K per 1,000 square feet of garden space.
Follow these steps to determine how much fertilizer to use:
- Choose a fertilizer with an appropriate content analysis. For example, you can choose a 12-4-8 fertilizer, but not a 5- 10-10.
- Calculate how much 12-4-8 is needed for 1,000 square feet of coverage. Divide the amount of nitrogen recommended for 1,000 square feet (3 lb) by the percentage of nitrogen in the fertilizer (12), and multiply by 100:
(3 lb ÷ 12) × 100 =
25 lb per 1,000 square feet - Calculate the area of your garden space. If it is a rectangle, the area is length times width. For example, a garden 20 feet long by 10 feet wide has an area of:
20 ft × 10 ft = 200 square feet
If your garden is an odd shape, divide it into rectangles, calculate the area of each rectangle, and then add them together. - Calculate the amount of fertilizer needed for your garden. Divide the area of your garden (200 square feet) by the area specified in the fertilizer recommendation (1,000 square feet). Then multiply by the fertilizer amount calculated in step 2 above:
(200 square feet ÷ 1,000 square feet) × 25 lb = 5 lb of 12-4-8 fertilizer
This is the amount of fertilizer needed for your garden.
How to Apply Fertilizer
If a large garden area will be planted all at the same time, measure the fertilizer into a hand-held broadcast spreader or drop spreader, apply it, and then incorporate it using a rake or shallow tillage. To get a more uniform application, apply at a light rate, and go over the garden several times until the measured amount of fertilizer is gone. If any fertilizer falls onto pavement, sweep it off so that it will not run off into stormwater the next time it rains. Use this same method without incorporation for fertilizing lawns and trees.
Example 2. Organic Fertilizer Calculation:
A recommendation calls for applying fertilizer to rhubarb at a rate of 1 oz of N per plant. A soil test shows there is no need to add P, so an organic fertilizer with an 8-0-4 label would be suitable. Based on this information, how much fertilizer should be applied to each plant?
- Estimate how much available N is in the fertilizer. Table 10 shows that a fertilizer with 8% total N will have roughly 75% of that N available during the growing season, or 6% available N.
- Calculate how much fertilizer to apply. Table 12 shows that to supply 1 oz of N using a fertilizer with 6% available N, 1 lb of fertilizer is needed.
| Crop | Nitrogen Rate | Application Timing |
|---|---|---|
| Blueberry | 0.6–0.8 oz N/plant | Split into three applications: April, May, and June |
| Raspberry | 2 oz N/10 ft row | Split into three applications: When primocanes emerge, late May, late June |
| Strawberry | 1.5–2 oz N/100 ft2 | June bearing: Apply in August Day-neutral: Split into three applications between April and August |
| Asparagus | 2 oz N/100 ft2 | Before shooting or after harvest ends |
| Rhubarb | 1 oz N/plant | Split into two applications: Early spring and after completing harvest (June) |
Adapted from the following publications: Hart et al. 2006; Strik 2008; Strik 2013; Jauron 2004; Stephan et al. 2017.
Gardeners often need to fertilize areas that are too small for a spreader, such as individual plants or rows, so they should fertilize these areas by hand. Since fertilizer recommendations are calculated by weight, weigh the fertilizer to determine the correct amount, transfer it to a cup, pint, or quart container, and mark the volume on the container. The marked container can be used for future applications. Incorporate the fertilizer into garden soil using a rake or hand-held cultivator. Do not incorporate fertilizer around shallow-rooted berry crops, where cultivation could damage roots.
Soil Management to Protect the Environment
Home gardens and landscapes benefit the environment in many ways. They help mitigate climate change by sequestering carbon in soil organic matter in lawns, landscape beds, and amended garden beds. They provide habitat for pollinators and other wildlife. Permeable garden and landscape soils allow infiltration of stormwater, reducing runoff and water pollution. Green spaces have a cooling effect in urban heat islands.
Gardens and landscapes can also contribute to water pollution and greenhouse gas emissions, but following simple steps can reduce environmental harm. To protect water quality:
- Apply fertilizers at the appropriate rates, places, and times. Use soil tests and Extension publications as guidance.
- Remember that even organic fertilizers and amendments can be sources of pollution if over-applied or allowed to run off into surface water.
- Keep fertilizers and amendments off paved surfaces. Sweep surfaces clean if fertilizers fall on them.
- Use unfertilized buffers (grass or mulches) between gardens and paved surfaces or areas prone to runoff.
- Protect bare soil during the winter using cover crops, winter crops, or mulches.
- Cover piles of compost or manure during the winter to reduce leaching and runoff.
Soil and garden management also affects greenhouse gas emissions. Increasing greenhouse gas levels are responsible for climate change. Emissions from gardening practices are small compared with household emissions from transportation and heating. Nonetheless, we can reduce gardening greenhouse gas emissions—particularly, methane and nitrous oxide—by taking the following steps:
- Keep yard waste and food waste out of landfills. Compost yard waste and vegetable scraps at home, or place yard waste and food waste in bins for curbside pickup and composting. This reduces methane emissions from anaerobic decomposition in landfills.
- Avoid overapplication of nitrogen fertilizers of any form. Some nitrogen is lost from soil as nitrous oxide (N2O) (See Figure 10 and the section The Nitrogen Cycle), and higher rates of N increase nitrous oxide emissions.
- Use organic sources of nitrogen to reduce methane emissions. Methane leakage to the atmosphere occurs in the production of processed nitrogen fertilizers and in the extraction of natural gas used to make nitrogen fertilizers.
Fertilizing Landscape Trees and Shrubs
Woody plants have lower nutrient requirements than annual vegetable crops because they grow more slowly and have more extensive root systems. Woody plants in the Pacific Northwest sometimes benefit from nitrogen fertilization, but seldom from potassium, and almost never from phosphorus. Soil testing will show if there are any nutrient needs besides nitrogen.
Plants that lack nitrogen often have smaller, yellower leaves, and are more susceptible to damage from insects. Other soil issues, including shallow depth, compaction, and droughtiness also stress plants. Before applying fertilizer, check soil depth, compaction, and texture. This requires some patient digging but will also indicate if soil physical issues are a main source of the problem. If so, fertilization is less likely to improve plant health.
If you do fertilize landscape trees and shrubs, use a fertilizer that contains N, but little or no P and K (unless a soil test indicates otherwise). Apply either organic or processed fertilizer across the root zone, but do not incorporate. Allow rainfall and irrigation to move nutrients into the soil. Nitrogen recommendations are typically in the range of 1 to 2 lb N/1,000 square feet (Neal 2018).
In the Pacific Northwest, the best time to apply fertilizer is in the spring when leaf growth begins. Fall fertilization with slow release fertilizers is also an option because the plants are storing reserves for spring growth. But, the risk of leaching and runoff of nutrients and the risk of stimulating tender growth susceptible to freeze damage is greater with fall fertilization.
For more background on fertilizing landscape plants, refer to University of New Hampshire Cooperative Extension publication Fertilizing Trees and Shrubs (Neal 2018).
Glossary of Terms
actinomycetes—A group of soil bacteria that resemble fungi in appearance. Actinomycetes are the source of many antibiotics used in human medicine.
aeration—A process by which air is circulated through, mixed with, or dissolved in a substance.
aggregation—The process by which individual particles of sand, silt, and clay, and organic matter cluster and bind together to form peds.
anion—A negatively charged ion. Plant nutrient examples include nitrate (NO3-), phosphate (H2PO42-), and sulfate (SO42-).
aspect—Direction of exposure to sunlight.
biosolids—Products of municipal wastewater treatment that contain nutrients, organic matter, and inorganic constituents. Class A biosolids have been treated to remove pathogens and are suitable for use in gardens and landscapes. Biosolids composts and blends are soil amendments, while dried biosolids products are used as fertilizers.
capillary force—The action by which water molecules bind to the surfaces of soil particles and to each other, thus holding water in fine pores against the force of gravity.
cation—A positively charged ion. Plant nutrient examples include calcium (Ca2+) and potassium (K+).
cation exchange capacity (CEC)—A soil’s capacity to hold cations as a storehouse of reserve nutrients.
clay—The smallest type of primary soil particle (less than 0.002 mm in diameter).
C:N ratio—The ratio of carbon to nitrogen in organic materials. Materials with a high C:N ratio (nitrogen-poor) are good mulches or bulking agents in compost piles, while those with a low C:N ratio (nitrogen-rich) are good nutrient sources.
cold composting—A slow composting process that involves simply building a compost pile and leaving it until it decomposes. This process may take a year or longer. Cold composting does not kill weed seeds or pathogens.
compaction—Pressure that squeezes soil into layers that resist root penetration and water movement. Often the result of foot or machine traffic.
compost—Stabilized organic matter produced by the controlled biological decomposition of organic materials. Compost is used as a soil amendment to increase soil organic matter and to slowly release nutrients.
cover crop—Plants grown to protect soil from water runoff and soil erosion and to add organic matter to soil.
decomposition—The breakdown of organic materials by microorganisms.
denitrification—Biological conversion of nitrate to nitrogen gas (N2) and nitrous oxide (N2O). Denitrification occurs in soil zones saturated with water and depleted of oxygen.
dolomitic limestone—A type of limestone that contains magnesium as well as calcium.
electrical conductivity—A measure of soil salinity (salt accumulation).
eutrophication—A process by which bodies of water receive excess nutrients (typically phosphorus in fresh water) resulting in excess algae growth and subsequent loss of oxygen when the algae die and decay.
fertilizer—A natural or synthetic product added to the soil to supply plant nutrients.
fertilizer analysis—The amount of nitrogen, phosphorus (as P2O5), and potassium (as K2O) in a fertilizer, expressed as percent of fertilizer weight. Nitrogen (N) is always listed first, phosphorus (P) second, and potassium (K) third.
Frankia bacteria—Bacteria that live in association with roots of alders and some other plants and convert atmospheric nitrogen to plant-available forms, a process known as nitrogen fixation.
green manure—Cover crops that are grown to incorporate into the soil for nutrient and organic matter benefits, or left on the soil surface as mulch.
helminths—Wormlike parasites that affect humans and other animals.
hot composting—A fast composting process that produces finished compost in two to four months. High temperatures are maintained by mixing balanced volumes of energy materials and bulking agents, keeping the compost pile moist, and turning it frequently.
immobilization—The process by which soil microorganisms use available nitrogen as they break down materials with a high C:N ratio, thus reducing the amount of nitrogen available to plants.
infiltration—The movement of water into soil.
ion—An atom or molecule with either a positive or negative electrical charge.
leaching—Movement of water and soluble nutrients down through the soil profile.
lime—Ground limestone rock (calcium carbonate, CaCO3) applied to soil to raise pH.
loam—A soil with roughly equal influence from sand, silt, and clay particles.
macropore—A large soil pore. Macropores include earthworm and root channels, and they control a soil’s permeability and aeration.
micronutrient—A nutrient used by plants in small amounts (iron, zinc, molybdenum, manganese, boron, copper, and chlorine). Also called a trace element.
micropore—A small soil pore, typically a fraction of a millimeter in diameter. Micropores are responsible for a soil’s ability to hold water.
mycorrhizal fungi—Beneficial fungi that inoculate plant roots and increase their ability to take up nutrients from the soil.
nitrifier—A microbe that converts ammonium to nitrate.
nitrogen cycle—The sequence of biochemical changes undergone by nitrogen as it moves from living organisms, to decomposing organic matter, to inorganic forms, and back to living organisms.
nitrogen fixation—The conversion of atmospheric nitrogen into plant-available forms by Rhizobia bacteria.
organic amendment—A material of biological origin that is added to soil to build soil organic matter and improve soil health. Examples include compost, manure, and cover crop residues.
organic fertilizer—A natural fertilizer material that has undergone little or no processing. It can include plant, animal, and/or mineral materials. Organic fertilizers are generally richer in nutrients than organic amendments.
organic mulch—An organic material (often woody) that is placed on the surface of the soil to reduce evaporation loss, protect the soil surface from erosion, smother weeds, and buffer soil temperature changes. Examples include ground bark, arborist chips, and straw.
pathogen—A disease-causing organism. Pathogenic soil organisms include bacteria, viruses, fungi, and nematodes.
ped—A cluster of individual soil particles. permeability—The rate at which water moves through a soil.
pH—A measure of soil acidity or alkalinity. Values less than 7 indicate acidity, a value of 7 is neutral, and values greater than 7 indicate alkalinity. Most soils have a pH between 4.5 and 9.
phosphate—The form of phosphorus listed in most fertilizer analyses (P2O5).
potash—The form of potassium listed in most fertilizer analyses (K2O).
primary nutrient—A nutrient required by plants in large amounts (nitrogen, phosphorus, and potassium).
processed fertilizer—A fertilizer that is manufactured or is refined from natural ingredients into a more concentrated form that is more available to plants.
quick-release fertilizer—A fertilizer that contains nutrients in plant-available forms such as ammonium and nitrate.
Rhizobia bacteria—Bacteria that live in association with roots of legumes and convert atmospheric nitrogen to plant-available forms, a process known as nitrogen fixation.
rhizosphere—The thin layer of soil immediately surrounding plant roots.
sand—The coarsest type of primary soil particle (0.05 to 2 mm in diameter).
secondary nutrient—A nutrient needed by plants in a moderate amount (sulfur, calcium, and magnesium).
silt—A primary soil particle of intermediate size (between the size of sand and clay) at 0.002 to 0.05 mm in diameter.
slow-release fertilizer—A fertilizer material that is converted into a plant-available form by soil microorganisms.
soil—A natural, biologically active mixture of weathered rock fragments and organic matter at the earth’s surface.
soil health—The continued capacity of a soil to function as a vital living ecosystem that sustains plants, animals, and humans.
soil salinity—The saltiness of a soil. Saline soils contain enough soluble salts to harm seed germination and crop growth.
soil solution—The solution of water and dissolved minerals found in soil pores.
soil structure—The arrangement of aggregates (peds) in a soil.
soil texture—How coarse or fine a soil is. Texture is determined by the proportions of sand, silt, and clay in the soil.
sylvinite—Potassium-containing mineral that is processed into potassium chloride fertilizers.
water-holding capacity—The ability of a soil’s pores to hold water for plant use.
References
Bary, A., C. Cogger, and D. Sullivan. 2016. Fertilizing with Manure and Other Organic Amendments. Pacific Northwest Extension Publication PNW533. Washington State University.
Benedict, C., C. Cogger, and N. Andrews. 2014. Methods for Successful Cover Crop Management in Your Home Garden. Washington State University Extension Publication FS119E. Washington State University.
Chalker-Scott, L. 2017. A Gardener’s Primer to Mycorrhizae: Understanding How They Work and Learning How to Protect Them. Washington State University Extension Publication FS269E. Washington State University.
Cogger, C.G. 2005. Potential Compost Benefits for Restoration of Soils Disturbed by Urban Development. Compost Science and Utilization 13:253–251.
Cogger, C.G. 2010a. How to Take a Soil Sample, video. Washington State University Extension. Washington State University.
Cogger, C.G. 2010b. Determining Soil Texture by Hand, video. Washington State University Extension. Washington State University.
Cogger, C.G. 2017. Raised Beds: Deciding If They Benefit Your Vegetable Garden. Washington State University Extension Publication FS075E. Washington State University.
Cogger, C.G. 2019a. Using Biosolids in Gardens and Landscapes. Washington State University Extension Publication FS156E. Washington State University.
Cogger, C.G. 2019b. Garden Fertilizer Calculator. Washington State University Extension Publication FS324E. Washington State University.
Cogger, C.G, C. Benedict, N. Andrews, S. Fransen, and A. McGuire. 2014a. Cover Crops for Home Gardens East of the Cascades. Washington State University Extension Publication FS117E. Washington State University.
Cogger, C.G., C. Benedict, N. Andrews, and A. McGuire. 2014b. Cover Crops for Home Gardens West of the Cascades. Washington State University Extension Publications FS111E. Washington State University.
Cogger, C.G., and G. Stahnke. 2019. Organic Soil Amendments in Yards and Gardens: How Much is Enough? Washington State University Extension Publication FS123E. Washington State University.
Cogger, C.G., D.M. Sullivan, and A. Bary. 2017. Backyard Composting. Washington State University Extension Publication EB1784E. Washington State University.
Fery, M., J. Choate, and E. Murphy. 2018. A Guide to Collecting Soil Samples for Farms and Gardens. Oregon State University Extension Service Publication EC628. Oregon State University.
Gale, E.S., D.M. Sullivan, C.G. Cogger, A.I. Bary, D.D. Hemphill, and E.A. Myhre. 2006. Estimating Plant Available Nitrogen Release from Manures, Composts, and Specialty Products. Journal of Environmental Quality 35:2321–2332.
Hart, J., D. Horneck, R. Stevens, N. Bell, and C.G. Cogger. 2003. Acidifying Soil for Blueberries and Ornamental Plants in the Yard and Garden West of the Cascade Mountain Range in Oregon and Washington. Oregon State University Extension Service Publication EC 1560-E. Oregon State University.
Hart, J., B. Strik, L. White, and W. Yang. 2006. Nutrient Management for Blueberries in Oregon. Oregon State University Extension Service Publication EM 8918. Oregon State University.
Horneck, D.A., D.M. Sullivan, J.S. Owen, and J.M. Hart. 2011. Soil Test Interpretation Guide. Oregon State University Extension Service Publication EC 1478. Oregon State University.
Jauron, R. 2004. Answers to Frequently Asked Asparagus Questions. Horticulture and Home Pest News Iowa State University Extension and Outreach. Iowa State University.
Locke, K., D. Horneck, J. Hart, and R. Stevens. 2006. Acidifying Soil in Landscapes and Gardens East of the Cascades. Oregon State University Extension Service Publication EC 1585-E. Oregon State University.
Neal, C. 2018. Fertilizing Trees and Shrubs. The University of New Hampshire Cooperative Extension Publication.
Peters, T. 2011. Drip Irrigation for the Yard and Garden. Washington State University Extension Publication FS030E. Washington State University.
Rosen, C.J., and R. Eliason. 2005. Nutrient Management for Commercial Fruit & Vegetable Crops in Minnesota. University of Minnesota Extension Service Publication BU-05886. University of Minnesota.
Shober, A.L., and G.C. Denny. 2017. Identifying Nutrient Deficiencies in Ornamental Plants. University of Delaware Cooperative Extension. University of Delaware.
Stephan, T., J. Parsons, N.S. Mansour, and J.R. Baggett. 2017. Grow Your Own Rhubarb. Oregon State University Extension Service Publication EC 797. Oregon State University.
Strik, B.C. 2008. Growing Raspberries in Your Home Garden. Oregon State University Extension Service Publication EC 1306. Oregon State University.
Strik, B.C. 2013. Growing Strawberries in Your Home Garden. Oregon State University Extension Service Publication EC 1307.
Sullivan, D.M., C.G. Cogger, and A.I. Bary. 2015. Fertilizing with Biosolids. Oregon State University Extension Service Publication PNW 508. Oregon State University.
Sullivan, D.M., E. Peachey, A.L. Heinrich, and L.J. Brewer. 2017. Nutrient Management for Sustainable Vegetable Production Systems in Western Oregon. Oregon State University Extension Service Publication EM 9165. Oregon State University.
Washington State Pest Management Resource Service. n.d. Analytical Laboratories and Consultants Serving Agriculture in the Pacific Northwest. Washington State University.
By
Craig Cogger, Scientist/Extension Specialist, Department of Crop and Soil Sciences, Washington State University

EM063E

Copyright © Washington State University
WSU Extension publications contain material written and produced for public distribution. Alternative text descriptions for select complex images were generated using ChatGPT (OpenAI), then reviewed and adapted to ensure compliance with Web Content Accessibility Guidelines (WCAG) accessibility standards.
Issued by Washington State University Extension and the US Department of Agriculture in furtherance of the Acts of May 8 and June 30, 1914. Extension programs and policies are consistent with federal and state laws and regulations on nondiscrimination regarding race, sex, religion, age, color, creed, and national or ethnic origin; physical, mental, or sensory disability; marital status or sexual orientation; and status as a Vietnam-era or disabled veteran. Evidence of noncompliance may be reported through your local WSU Extension office. Trade names have been used to simplify information; no endorsement is intended.