Implementing Genomic Selection in Beef Herds
Description
Learn how the pedigree and performance of your herd can be improved using the latest genetic selection tools. A great resource for cattle producers, veterinarians, consultants, or anyone working in the beef industry.

Abstract
This publication will discuss genomic selection technologies and tools available to beef producers and how they may be used or applied. Beef producers, veterinarians, and consultants will also find information regarding the benefits of genomic selection and how genomic tools can improve the beef industry.
Introduction
Genomic selection, or the combined use of genotypes, performance, and pedigree information, is a useful tool for livestock producers. Though genomic selection has been embraced by the dairy and purebred beef industry, it has just recently become available for the commercial or crossbred beef industry. Genomic selection is a tool that can be used to identify superior heifers born in the herd that should be kept as replacements or bred to superior bulls. Genomic selection is also helpful for identifying the bottom tier of heifers that should be culled and confirming offspring parentage.
To assess current usage and desire to learn about genomic selection as a tool, a survey was used to quantify present adoption rates and barriers to adopting genomic selection tools within beef operations in the western United States. The survey also aimed to identify potential areas where outreach programs are needed to facilitate education and assist genomic selection adoption. The survey content was based on beef producers’ current management practices and was available online from September 15, 2022, to January 1, 2023. Surveys were dispersed through Western Cattlemen’s Associations. Upon their completion, response frequencies for each of the questions were recorded.
Survey Results
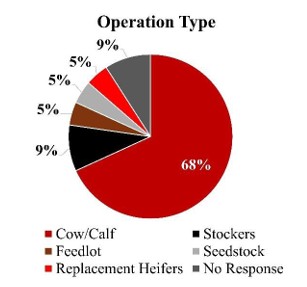
Nineteen surveys were completed by beef producers, and questions encompassed background information about the herds, including state location, operation type, and cattle breeds used. Producers described their breeding goals and objectives, any present genomic selection use, and their current understanding of genomic selection.
Sixty-eight percent of producers that responded had a cow/calf operation, 9% had stockers, 5% had feedlots, 5% raised replacement heifers, and 5% were seed stock producers (Figure 1). Crossbreds comprised 74% of the respondents’ herds.
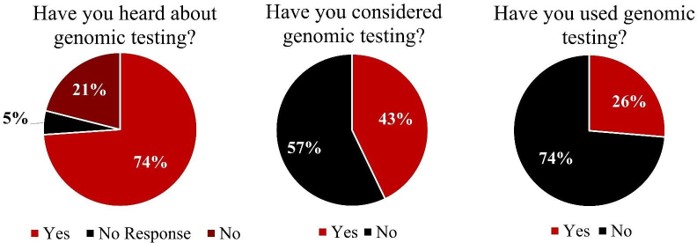
Many producers (74%) stated they had seen information about genomic testing and selection. However, only 26% stated they had used genomic testing within their herd (Figure 2). Those who had used genomic selection were cow/calf or seed stock producers.
Over half of producers (57%) who had not used genomic selection tools stated that they had not even considered using genomic selection (Figure 2). Producers identified barriers to using genomic selection, including identifying if there was a positive return on investment when using genomic tools, learning how to interpret the expected progeny differences (EPD) results, and concern over the prediction accuracy.
Survey responses indicate that producers using genomic selection may not utilize the information to its fullest extent, as many reported hearing about genomic selection but less than half considered it and fewer actually used it. Education may help producers better understand how the tools work and how to maximize their investment while having the potential to assist producers in capturing further returns on their investment.
The average US cow-calf herd size is approximately 44 head (USDA-NASS 2024). Although only 10% of all beef producers have more than 50 animals, they represent 56% of the beef cattle inventory (Knight 2023). There are benefits to using genomic selection regardless of herd size. Genomic selection education and implementation provide an opportunity to improve a herd’s overall return on investment and reduce financial risk by providing more accurate information on which animals to choose for breeding.
Genomic Selection Overview
Genomic selection is the use of DNA to make decisions on selecting females to keep in the breeding herd, choosing sires to mate with heifers and cows, and determining parentage. Genomic selection was commercially introduced to the cattle industry in 2009 to more accurately select for traits (Erf 2020). Selecting animals that excel in growth, reproduction, and health traits can advance the genetic merit of individual herds, specific breeds, and industry as a whole. Identifying and retaining elite animals that meet specific production and management goals is one tool that cattle producers can use to advance their breeding program.
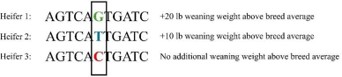
Genomic selection evaluates an individual’s genetic makeup (DNA) and compares it to a reference population from the same breed. In cattle, genetic variants associated with economically important traits have been identified to predict their offspring’s performance. These predictions are called EPDs, which measure differences expected in the offspring compared to the average offspring. Differences present within the individual’s own genetic makeup, termed single nucleotide polymorphisms, or SNPs, may lead to differences in the physical expression of traits. These SNPs are often used to determine EPDs. A nucleotide is part of DNA’s molecular structure, and there are four unique nucleotides that comprise it. The nucleotides are abbreviated as A (adenine), T (thymine), C (cytosine), and G (guanine). When one nucleotide is replaced with another, it is termed a SNP. Figure 3 highlights an example of a SNP within the DNA sequences for three heifers. By identifying the SNP at this location, it is possible to estimate the weaning weight in the heifer’s offspring relative to the herd average.
EPDs can be calculated for many traits such as weaning weight, average daily gain, and conception rate. Analyzing an individual’s DNA and determining their EPD can happen at any time in the animal’s life. Genomic selection provides an opportunity for a producer to know the individual’s EPDs months before the traits would be expressed. These estimates can then be used to make management decisions earlier, potentially reducing financial risk and developing a genetically superior herd.
Genomic selection is another “tool in the toolbox,” similar to the utilization of a nutritionist, veterinarian, feed management software, or detailed record systems that assist in a herds’ progress and advancements over time. Genomic selection can be an extremely useful investment if the data and information gathered from the testing is used effectively for mating decisions, culling, and refining herd goals and benchmarks. Heifer inventories can be split apart by their genomic rank for whatever trait or traits the producer is basing selection decisions on (e.g., weaning weight), and if a culling opportunity presents itself, those ranked in the bottom proportion may be selected to sell. Furthermore, those remaining at breeding age can be selectively mated to improve the next generation of calves from top-ranked parents.
Selection Before Genomics
Selecting cattle to remain in the breeding herd has been occurring throughout the beef industry long before genomics. Traditional selection methods that are still used throughout the industry encompass selection based on visual evaluation or with EPDs and performance data collected from related individuals. Historically, EPDs are based on available parental information. This may be limited to the sire’s EPD or his genomic EPD (GEPD), if the sire himself was genomically tested. A traditional EPD is calculated using recorded offspring or relatives’ performance, whereas a GEPD may be available for bulls that have yet to sire a calf using his DNA. However, when using these estimates to identify the expected merit of progeny, it is essential to remember that both the dam and the sire contribute equally to the genetic merit of the calf.
Gaining information on the bull will only account for half of the information that the calf inherits, so the prediction accuracy for the calf will be much less than if genomic information was collected on the calf itself. Only by evaluating the calf’s own DNA are we able to predict its performance more accurately.
When comparing pedigree-based selection to unproven bulls with genomic expected progeny differences, those with GEPDs have similar accuracies to a bull who had sired 8–35 calves, depending on the trait (American Angus Association 2024). In addition to genomic selection having a higher reliability, reaching high-reliability values using traditional methods can take several years as it requires more progeny to increase the reliability. Comparatively, genomic evaluations have SNP information that is continually updated on all sires and dams, resulting in higher reliabilities at the time of testing.
How to Start
DNA Sampling Methods
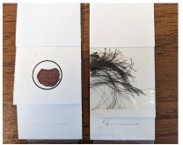
Different options are available to choose from when selecting which genetic sampling method works best for your operation. The most common sample types include blood, tissue samples, or hair follicles. Semen collection or nasal/oral swabs may also be used. Genotyping from blood samples is widely used, and a few options are available. The left panel of Figure 4 shows a blood card, otherwise known as an FTA card (fast technology for analysis of nucleic acids), which is an absorbent paper that requires only a few drops of blood. FTA cards preserve the sample’s quality without any genomic deterioration and can be refrigerated or stored at room temperature prior to testing (Burt 2009). Another option is collecting whole blood in vacutainers; however, a larger amount is required (approximately two teaspoons) and samples must be refrigerated in a collection tube with a nonclotting agent. A third option is shown on the right panel of Figure 4, which is the collection of hair with an intact root bulb. Commonly, hair samples are collected by removing a small amount of tail hair. It is important to ensure that the hair bulb remains intact when taking a sample, as this is where the genetic material is contained. Samples are then collected within an envelope or stuck to adhesive on a card (Figure 4) (Burt 2009).
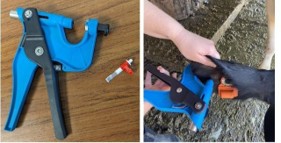
Various tissues can also be used for genetic testing. Figure 5 demonstrates collecting ear tissue for genomic analysis. This is commonly done on-farm using a tissue sampling unit (TSU) to take an ear punch. The tissue sample is pushed into a tube containing preservatives, and the top is sealed immediately after the sample is collected. The sample can be kept at room temperature and contains an individual identification code to assist with recordkeeping. The TSU can also be used to insert an ear tag into the punch used for tissue collection. Semen straws can be sent for genetic testing as can nasal or oral swabs that scrape and remove cells from the surface of the skin, which can then be used for DNA evaluation.
The different sampling approaches vary in cost, from approximately one dollar to $2.50 each. FTA blood cards each cost approximately one dollar, and cards used to collect hair samples are approximately $1.50. Allflex TSUs are approximately $2.50 each. If using the Allflex TSU for sampling, it is recommended that you purchase the $45 reusable applicator to collect the tissue punch (Neogen 2024). Prices for oral or nasal swabs range from one dollar to $2.50 each.
Testing Costs
Costs associated with each testing option depend on the specific testing that is desired and the selected company. Different genomic testing options are available depending on the information that the producer wants. Table 1 highlights testing costs available through Neogen or Zoetis for commercial or crossbred cattle. The tests listed in Table 1 provide GEPDs on a comprehensive list of traits used for beef cattle selection, although add-on tests that are specific for traits such as polled or having a black hair coat are also available (Neogen 2024; Zoetis 2024). Since producers can make the best choice and tests are updated regularly, it is recommended that producers contact a company for current options and pricing.
Once the company and genomic test have been selected and samples collected, then samples must be sent to the company for processing. These samples are submitted by completing an online form that includes information regarding identification numbers, birth dates, breeds, sex, sample type, and the genomic test requested. This information will be included with the genotyping information when results are returned. The samples are then mailed to the company for processing.
Selection Opportunities
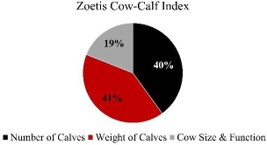
Producers select the traits or indexes that will help them reach their breeding and selection goals. Selecting an individual trait can be beneficial if there is a singular area the producer wishes to improve or change. An example includes selecting increased weaning weights to help improve the profits of a cow-calf operation, especially if this is an area of deficiency for the herd. However, this selection method can have negative effects. When focusing on a singular trait, other important traits may unintentionally be selected against. Alternatively, an index shows a combination of several traits and is represented by a single value. Each trait is weighted in the index before being combined into a single value. In an economic selection index, the trait weights are based on profitability, whereas in other indexes, the weight is based on its importance to the producer’s breeding goals. An example of an economic index provided for crossbred cattle by Zoetis is dollar profit (denoted as $P) that focuses on a range of traits from the pre- to postweaning period, including feedlot and carcass performance and Zoetis Cow-Calf index (ZCC) as shown in Figure 6. Some producers may want to focus on specific traits, which will be detailed along with index values in the reports received from the genetic testing company.
Table 1. Different genomic tests for beef cattle and corresponding information for each. The first three listed are offered through Zoetis and the bottom three are offered through Neogen. These products include a ranking that compares the tested animal’s GEPD values to all tested animals of that breed in the United States.| Test | Base Price | Data Provided | Breeds Offered |
|---|---|---|---|
| Zoetis INHERIT Select | $40/sample | GEPDs for 19 traits and 5 economic indexes for females | Crossbred cattle consisting of Angus, Red Angus, South Devon, Hereford, Simmental, Gelbvieh, Limousin, and Charolais |
| Zoetis INHERIT Connect | $20/sample | Add-on for herd sires of females tested with INHERIT Select to determine parentage | Crossbred cattle consisting of Angus, Red Angus, South Devon, Hereford, Simmental, Gelbvieh, Limousin, and Charolais |
| HD 50K | $37/sample | GEPDs for seed stock populations | Angus |
| Igenity Beef | $30/sample | 1–10 scale for popular traits Actual GEPDs are not given | Designed for crossbreds |
| Igenity Feeder | $15/sample | Provides data based on the Terminal Index and Days on Feed Index | Angus, Gelbvieh, Hereford, Limousin, Maine-Anjou, Red Angus, Shorthorn, and Simmental |
| Igenity Envigor | $21/sample | 1–10 scale for popular traits Actual GEPDs are not given | Angus, Brahman, Gelbvieh, Hereford, Limousin, Red Angus, Simmental, Wagyu, and many other breeds of cattle |
Conclusions
Genomic selection leads to the highest rate of progress when it is used to make selection decisions for replacing heifers, culling cows, sire selection, mating decisions and identifying parentage. Rates of progress will vary depending on the heritability of traits of interest, the intensity of selection, and how the genomic results are being utilized. Genomic selection can also reduce the financial risk and improve profitability by keeping animals that are predicted to perform well.
Glossary
- expected progeny difference (EPD)—Estimation of the transmitting ability of a trait from the parent to the offspring and is compared to the breed average. Data is commonly collected from available performance records.
- FTA card—Fast technology for analysis of nucleic acids card. Cotton-based paper with chemicals present that rupture cells and denature proteins in order to preserve the DNA without introducing diseases or pathogens and was created by Flinders Technology Associates (Santos 2018).
- genomic EPD (GEPD)—The difference from the individual’s predicted performance from a genomic test from the average for the breed, used for selective mating, culling, and genetic improvement.
- nucleotide—Building blocks of DNA. The possible options are A (adenine), T (thymine), C (cytosine), and G (guanine), and when in a sequence, encodes for bodily function.
- single nucleotide polymorphism (SNP)—The substitution of one nucleotide for another at a specific location in the genome, which can alter the performance of the individual.
- tissue sampling unit (TSU)—Allows for rapid and clean collection of a tissue sample, typically from the ear in cattle, to be sent for processing.
References
- American Angus Association. 2024. American Angus Association®: Genomic Enhanced – EPDs (GE-EPDs) (PDF document). AGI.
- Anderson, K., F. Di Croce, and T. Short. 2022. INHERIT Select™ for Commercial Females Technical Summary (PDF document). Zoetis.
- Burt, A. 2009. DNA Dos & Don’ts. Beef Magazine.
- Erf, D. 2020. A Decade of Genomic Testing with Greater Opportunities Ahead. Progressive Dairy.
- Knight, R. 2023. Cattle & Beef—Sector at a Glance. USDA ERS.
- Neogen. 2022. The Advantage of Tissue Sampling Units (TSUs) (PDF document).
- Neogen. 2024. Neogen® Beef Genomics.
- Santos, G. 2018. FTA Cards for Preservation of Nucleic Acids for Molecular Assays: A Review on the Use of Cytologic/Tissue Samples. Archives of Pathology and Laboratory Medicine 142(3): 308–312.
- USDA-NASS (National Agricultural Statistics Service). 2024. Census of Agriculture.
- Zoetis. 2024. Genetic Testing Your Cattle. Inherit Products.

By Allison Herrick, PhD Candidate, Department of Animal Sciences; Shannon Neibergs, Director Western Center for Risk Management Education and Extension Specialist, Agriculture and Natural Resources; Holly Neibergs, Professor, Department of Animal Sciences.

Copyright © Washington State University.
WSU Extension publications contain material written and produced for public distribution. Alternate formats of our educational materials are available upon request for persons with disabilities. Please contact Washington State University Extension for more information.
Issued by Washington State University Extension and the US Department of Agriculture in furtherance of the Acts of May 8 and June 30, 1914. Extension programs and policies are consistent with federal and state laws and regulations on nondiscrimination regarding race, sex, religion, age, color, creed, and national or ethnic origin; physical, mental, or sensory disability; marital status or sexual orientation; and status as a Vietnam-era or disabled veteran. Evidence of noncompliance may be reported through your local WSU Extension office. Trade names have been used to simplify information; no endorsement is intended. Published January 2025.