2026 Cost Estimates of Establishing, Producing, and Packing Late-Season Mahogany Sweet Cherries in Washington State
Description
This publication offers growers insights into the costs, requirements, and economic feasibility of establishing, producing, or packing late-season mahogany sweet cherry using the latest data from 2025 and 2026.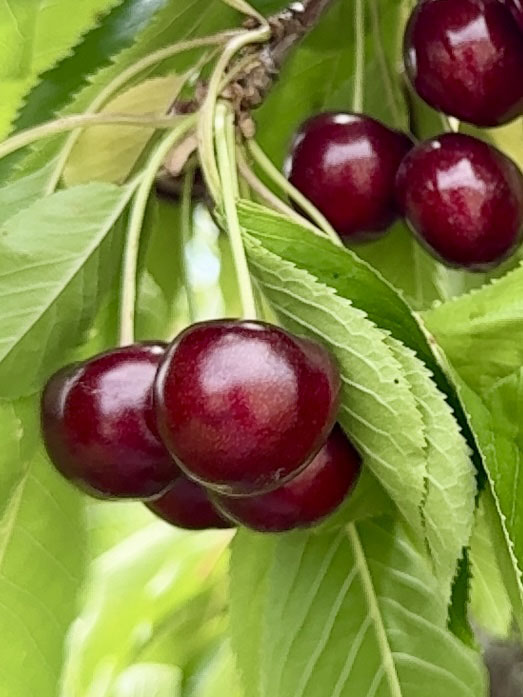
Preface
The results presented in this WSU publication serve as a general guide for evaluating the feasibility of producing late-season mahogany sweet cherries in Washington State. The analysis relies primarily on input cost centers representative of the 2025 production year, with labor rates updated to reflect prevailing conditions as of 2026.
This publication is not intended to be a definitive guide to production practices, but it is intended to be helpful in estimating the physical and financial requirements of comparable plantings. Specific budget assumptions were adopted for this study, but these assumptions may not represent the conditions in all production and marketing situations, since production costs and returns vary across orchard operations depending on the following factors:
- Capital, labor, and natural resources
- Crop production
- Type and size of machinery, irrigation, and frost control systems
- Input prices
- Cultural practices
- Sweet cherry prices
- Orchard size
- Management skills
Cost estimations in the enterprise budget also vary depending on the budget’s intended use. To avoid drawing unwarranted conclusions for any particular orchard, readers must closely examine the assumptions made in this guide and then adjust the costs, returns, or both as appropriate for their own orchard operation.
Late-Season Mahogany Sweet Cherry Production in Washington State
Washington State is the leading producer of sweet cherries in the United States. According to the USDA Noncitrus Fruits and Nuts 2024 Summary (May 2025), the utilized production of sweet cherries in the US totaled 360,710 tons in 2024, of which Washington accounted for 200,970 tons or about 56%. Sweet cherries remain one of Washington State’s highest value specialty crops, with a farm–gate value of approximately $434.8 million in 2024. In recent years, Washington’s share of total US sweet cherry production has generally ranged between 55% and 63%, depending on relative crop sizes and weather conditions across producing states (USDA NASS 2025). Seasonal timing plays a central role in determining both market access and price outcomes across the production calendar.
For the purposes of this study, late-season mahogany cherries are defined as fruit harvested on and after July 16. Late-season mahogany sweet cherries in Washington are primarily composed of varieties such as Sweetheart, Skeena (later blocks), Regina, Staccato, and other firm, mahogany-skinned cultivars selected for extended harvest timing and storage potential (WSU Tree Fruit 2026; Van Well Nursery 2026). Production during this period is concentrated in cooler districts and higher-elevation areas, including portions of the Wenatchee district and northern production regions, where later bloom and slower accumulation of growing degree days delay fruit maturity relative to central and southern growing areas (WSU Tree Fruit 2026). Compared to early-season fruit, late-season production reflects both varietal selection and geographic positioning strategies designed to extend market availability and maintain supply continuity into late July and August (WSU Tree Fruit 2026; Van Well Nursery 2026).
Based on shipment data from 2021–2025, late-season cherries account for approximately 35% of total shipped volume, compared to 11% for early-season fruit harvested on or before June 18 and 54% for mid-season cherries harvested between June 18 and July 15 (WSTFA 2026). Although late-season volume is smaller than mid-season, it represents more than one-third of annual shipments and plays a critical role in extending the Northwest marketing window into late July and August.
Weighted average free-on-board (FOB) prices from 2021–2025 indicate that late-season cherries received an average of approximately $2.23 per lb, compared to $2.67 per lb for early-season and $2.20 per lb for mid-season shipments (WSTFA 2026). On a per-pound basis, late-season fruit did not capture the scarcity premium observed in early-season markets and generally traded at prices similar to mid-season shipments.
From a market perspective, late-season varieties serve to extend the marketing season after peak mid-season volumes subside. These cultivars are typically selected for firmness, storage longevity, and export durability, allowing continued shipments after many orchards have already completed harvest (WSTFA 2026).
Study Objectives
The primary use of this report is in identifying inputs, costs, and production practices considered typical of well-managed, late-season mahogany sweet cherry orchards.
This publication is designed to enable growers to estimate (1) the costs of equipment, materials, supplies, and labor required to establish and produce late-season mahogany sweet cherries, including packing costs, and (2) the ranges of price and production at which late-season mahogany sweet cherry production would be a profitable enterprise.
Information Sources
The data used in this study were collected from information shared by a group of experienced late-season mahogany cherry growers in Washington. Selected orchard specifications are summarized in Table 1, while production, price, and cost assumptions are presented in the Budget Assumptions section and Table 2. The assumptions reflect what these owner-operators anticipate would occur over the life of an orchard, if no unforeseen failures occur. Given that many factors affect production costs, pack-out, and returns, individual growers can use the Excel Workbook (available at the WSU School of Economic Sciences Crop Enterprise Budgets) to make necessary modifications and estimate their own costs and returns.
| Block Specification | Description |
|---|---|
| Architecture | 2-leader non-formal V |
| In-row spacing | 6 feet |
| Between-row spacing | 14 feet |
| Rootstock | G-12 |
| Block size | 12 acres |
| Productive block size | 11 acres |
| Life of planting | 25 years |
| Tree density | 519 trees per acre |
Budget Assumptions
- Late-season mahogany sweet cherries are defined as fruit harvested on and after July 16. Large fruit correspond to 9-row and larger, medium fruit ranges from 9.5- to 10.5-row, and small fruit are 11-row and smaller.
- The area of the total farm operation is 300 acres of mixed conventional tree fruits. Bearing acres include: 225 acres of apples (75% of total area), 48 acres of sweet cherries (16%), and 27 acres of pears (9%).
- The 48-acre orchard is divided into four equal 12-acre blocks: three planted with mahogany sweet cherries scheduled for early-, mid-, and late-harvest windows, and one planted with yellow sweet cherries. In each block, one acre is allocated to infrastructure (roads, pond, loading area, and buildings), resulting in 11 bearing acres per block.
- The total value of bare, unimproved, agricultural land (including senior water rights) is $18,000 per acre with annual property taxes of $120 per acre.
- The irrigation system consists of overhead cooling and under-tree drip lines, with two separate sub-main lines. Water is provided through a public irrigation district.
- Cultural practices and harvest activities are done by using a combination of manual labor, ladders, and labor-enhancing equipment. The hourly manual labor rate is $21.63/hour, calculated using the minimum wage for 2026 of $17.13/hour, plus H-2A fixed cost of $4.50/hour. For chemical and fertilizer application, irrigation, and frost protection, the labor rate is $22.63/hour, a dollar more than the manual labor rate. These labor rates are assumed the same for all years of production.
- Free-on-board (FOB) prices are defined as the prices at the packinghouse door. FOB prices vary by fruit size: $2.35/lb for large-size cherries, $2.14/lb for medium-size, $1.78/lb for small size, and $0.04/lb for cull.
- Gross production refers to total harvested production (20,000 lb per acre) prior to sorting. Net production reflects marketable production after pack-out, where pack-out denotes the removal of cull fruit (19%) arising from preharvest, harvest, or storage losses. The remaining 81% of gross production is allocated across large-, medium-, and small-size categories.
- Management salary is valued at $700 per acre.
- Interest on investment represents a 5% opportunity cost to the enterprise. These are forgone earnings for investing money in orchard, equipment, and buildings rather than in an alternative activity. This also represents interest on funds borrowed to finance orchard, equipment, and building purchases.
Summary of Study Results
The estimated annual cost and returns for a 12-acre block of late-season mahogany sweet cherries in Washington are shown in Table 2. Production costs are classified into variable costs and fixed costs. Variable costs comprise orchard operations, harvest activities, materials, maintenance and repairs, and packing costs. Fixed costs are incurred whether or not sweet cherries are produced. These costs will generally be calculated for the whole farm enterprise and allocated across each unit of production. The fixed costs include depreciation on capital, interest, taxes, insurance, management, and amortized establishment costs. Management is treated as a fixed cost rather than a variable cost because, like land, management has been committed to the production cycle of the crop.
| Return or Cost | Description or Activity | Year 1 | Year 2 | Year 3 | Year 4 | Year 5 | Years 6–25 (Full Production, Annual Average) |
|---|---|---|---|---|---|---|---|
| Net production | Estimated production (lb/acre)a, large | 0.00 | 0.00 | 2,100.00 | 9,600.00 | 12,000.00 | 12,000.00 |
| Net production | Estimated production (lb/acre)a, medium | 0.00 | 0.00 | 700.00 | 3,200.00 | 4,000.00 | 4,000.00 |
| Net production | Estimated production (lb/acre)a, small | 0.00 | 0.00 | 35.00 | 160.00 | 200.00 | 200.00 |
| Culls | Estimated production (lb/acre)a, cull | 0.00 | 0.00 | 665.00 | 3,040.00 | 3,800.00 | 3,800.00 |
| Price | Estimated FOB price ($/lb)b, large | 0.00 | 0.00 | 2.35 | 2.35 | 2.35 | 2.35 |
| Price | Estimated FOB price ($/lb)b, medium | 0.00 | 0.00 | 2.14 | 2.14 | 2.14 | 2.14 |
| Price | Estimated FOB price ($/lb)b, small | 0.00 | 0.00 | 1.78 | 1.78 | 1.78 | 1.78 |
| Price | Estimated FOB price ($/lb)b, cull | 0.00 | 0.00 | 0.04 | 0.04 | 0.04 | 0.04 |
| Return | TOTAL RETURNS ($/acre) | 0.00 | 0.00 | 6,521.90 | 29,814.40 | 37,268.00 | 37,268.00 |
| Variable cost | Soil preparation | 2,811 | 0 | 0 | 0 | 0 | 0 |
| Variable cost | Trees (including labor) | 7,507 | 0 | 0 | 0 | 0 | 0 |
| Variable cost | Pruning & trainingc | 324 | 541 | 887 | 1,233 | 1,255 | 1,255 |
| Variable cost | Thinningc | 0 | 0 | 0 | 0 | 0 | 0 |
| Variable cost | Chemicalsd,e | 801 | 1,331 | 2,034 | 2,327 | 2,397 | 2,397 |
| Variable cost | Fertilizerd,e | 183 | 253 | 323 | 411 | 411 | 411 |
| Variable cost | Irrigation water & electric charge | 275 | 275 | 275 | 275 | 275 | 275 |
| Variable cost | Irrigation labore | 226 | 226 | 226 | 226 | 226 | 226 |
| Variable cost | Reflective cover laborf | 0 | 0 | 0 | 0 | 0 | 0 |
| Variable cost | Netting laborf | 0 | 0 | 0 | 0 | 0 | 0 |
| Variable cost | Beehives | 0 | 0 | 195 | 195 | 195 | 195 |
| Variable cost | General farm laborg | 100 | 100 | 100 | 100 | 100 | 100 |
| Variable cost | Picking laborh | 0 | 0 | 1,050 | 4,800 | 5,400 | 4,800 |
| Variable cost | Other labor (checkers, tractor drivers, supervisors)h | 0 | 0 | 525 | 2,400 | 3,000 | 3,000 |
| Variable cost | Hauling sweet cherriesh | 0 | 0 | 175 | 800 | 1,000 | 1,000 |
| Variable cost | Warehouse packing charges | 0 | 0 | 2,975 | 13,600 | 17,000 | 17,000 |
| Variable cost | Maintenance & repair | 250 | 250 | 285 | 285 | 285 | 285 |
| Variable cost | Fuel & lube | 180 | 135 | 140 | 160 | 180 | 180 |
| Variable cost | Overhead (5% of variable costs)i | 633 | 156 | 460 | 1,341 | 1,586 | 1,556 |
| Variable cost | Interest (5% of variable costs)j | 665 | 163 | 482 | 1,408 | 1,666 | 1,226 |
| Sum of all variable costs | Total variable costs | 13,955 | 3,430 | 10,132 | 29,561 | 34,976 | 33,906 |
| Return | Returns over variable costs | -13,955 | -3,430 | -3,611 | 254 | 2,292 | 3,362 |
| Fixed cash cost | Returns over variable costs | 190 | 190 | 190 | 190 | 190 | 190 |
| Fixed cash cost | Land & property taxes | 120 | 120 | 120 | 120 | 120 | 120 |
| Fixed cash cost | Insurance cost (farm and property) | 425 | 425 | 425 | 425 | 425 | 425 |
| Sum of fixed cash costs | Total fixed cash cost | 735 | 735 | 735 | 735 | 735 | 735 |
| Sum of all variable costs and fixed cash costs | Total cash costs | 14,690 | 4,165 | 10,867 | 30,296 | 35,711 | 34,641 |
| Return | Return over cash costs | -14,690 | -4,165 | -4,346 | -481 | 1,557 | 2,627 |
| Depreciation | Irrigation system | 128 | 128 | 128 | 128 | 128 | 128 |
| Depreciation | Reflective cover | 0 | 0 | 0 | 0 | 0 | 0 |
| Depreciation | Netting | 0 | 0 | 0 | 0 | 0 | 0 |
| Depreciation | Machinery, equipment & building | 378 | 378 | 378 | 378 | 378 | 378 |
| Depreciation | Main line & pump | 0 | 0 | 0 | 0 | 0 | 0 |
| Depreciation | Pond | 0 | 0 | 0 | 0 | 0 | 0 |
| Depreciation | Trellis | 140 | 140 | 140 | 140 | 140 | 140 |
| Depreciation | Wind machine | 132 | 132 | 132 | 132 | 132 | 132 |
| Interest | Irrigation system | 96 | 96 | 96 | 96 | 96 | 96 |
| Interest | Reflective cover | 0 | 0 | 0 | 0 | 0 | 0 |
| Interest | Netting | 0 | 0 | 0 | 0 | 0 | 0 |
| Interest | Landk | 900 | 900 | 900 | 900 | 900 | 900 |
| Interest | Machinery, equipment & building | 121 | 121 | 121 | 121 | 121 | 121 |
| Interest | Main line & pump | 0 | 0 | 0 | 0 | 0 | 0 |
| Interest | Pond | 0 | 0 | 0 | 0 | 0 | 0 |
| Interest | Trellis | 88 | 88 | 88 | 88 | 88 | 88 |
| Interest | Wind machine | 99 | 99 | 99 | 99 | 99 | 99 |
| Interest | Establishment costs (5%) | 0 | 874 | 1,265 | 1,684 | 1,931 | 0 |
| Other fixed cost | Management cost | 700 | 700 | 700 | 700 | 700 | 700 |
| Other fixed cost | Amortized establishment costsl | 0 | 0 | 0 | 0 | 0 | 3,353 |
| Sum of depreciation, interest and other fixed costs | Total fixed non-cash costs | 2,781 | 3,654 | 4,045 | 4,465 | 4,712 | 6,134 |
| Return | Return over cash costs and depreciation | -15,468 | -4,943 | -5,124 | -1,259 | 779 | 1,849 |
| Sum of fixed cash and non-cash costs | Total fixed costs | 3,516 | 4,389 | 4,780 | 5,200 | 5,447 | 6,869 |
| Sum of all costs | TOTAL PRODUCTION COSTS | 17,471 | 7,820 | 14,913 | 34,761 | 40,423 | 40,775 |
| Total returns minus total production costs | ESTIMATED NET RETURNS | -17,471 | -7,820 | -8,391 | -4,946 | -3,155 | -3,507 |
| Establishment cost | Accumulated establishment costs | 17,471 | 25,291 | 33,682 | 38,628 | 41,784 | - |
a Estimated production considers the respective portions of gross production that are classified as large, medium, small, and cull.
b These are packinghouse door prices. They reflect the return before any expenses are subtracted.
c Hand labor rate is $21.63/hour and includes all applicable taxes and benefits.
d Includes materials and labor.
e Tractor/machinery labor for chemical application, fertilizer application, and irrigation is $22.63 per hour, including all applicable taxes and benefits.
f Labor cost to deploy and pull back.
g General farm labor rate is a lump sum per acre and is applied to miscellaneous/all other labor. Rate includes applicable taxes and benefits.
h Picking rate = $0.30/lb in Years 3–4, $0.27/lb in Year 5, and $0.24/lb in Years 6–25. Checkers’ & tractor drivers’ rate = $0.15/lb. Hauling rate = $0.05/lb. (Hauling refers to transportation cost from the orchard to the warehouse. It is assumed that warehouse will cover additional transportation expenses—if any—when the orchard is located in remote areas.)
i Captures indirect costs of operations in the orchard that fluctuate with the level of production but are not accounted for by the variable costs already identified. Also captures unforeseeable expenses.
j Interest expense on full year during establishment years and for three-quarters of a year during full production.
k Land cost is approximated by using the 5% interest rate multiplied by the land value of $18,000 per acre.
l Represents the costs incurred during the establishment years (minus revenues during those years) that must be recaptured during the full production years. It is calculated as: accumulated establishment costs in Year 5 amortized at 5% for 20 years.
The study assumed that a late-season mahogany sweet cherry orchard could achieve full production in the sixth year. Based on the above assumptions, at full production, total returns average $37,268 per acre, compared to total variable costs of $33,906, total cash costs of $34,641, total cash costs plus depreciation of $35,419, and total production costs of $40,775. Returns exceed variable costs by $3,362 and cash costs by $2,627 per acre and remain positive at $1,849 after cash costs plus depreciation; however, estimated net returns are −$3,507 per acre once all fixed, interest, amortized establishment, and opportunity costs are included.
Table 3 reports break-even FOB prices per pound for late-season mahogany sweet cherries of different sizes under four cost categories—variable, cash, cash plus depreciation, and total economic costs—during full production. For any given cost category, the enterprise breaks even only if the break-even prices for all sizes are achieved simultaneously.
| Levels of Enterprise Costs | Sweet Cherry Size | Proportional Cost by Size ($/acre) | Break-Even Returna by Grade ($/lb) |
|---|---|---|---|
| Total Variable Costsb | Large | $25,656.00 | 2.14 |
| Total Variable Costsb | Medium | $7,787.78 | 1.95 |
| Total Variable Costsb | Small | $323.88 | 1.62 |
| Total Variable Costsb | Culls | $138.29 | 0.04 |
| Total Cash Costsc,d | Large | $26,212.16 | 2.18 |
| Total Cash Costsc,d | Medium | $7,956.60 | 1.99 |
| Total Cash Costsc,d | Small | $330.91 | 1.65 |
| Total Cash Costsc,d | Culls | $141.29 | 0.04 |
| Total Cash Costs + Depreciation Costse | Large | $26,800.81 | 2.23 |
| Total Cash Costs + Depreciation Costse | Medium | $8,135.28 | 2.03 |
| Total Cash Costs + Depreciation Costse | Small | $338.34 | 1.69 |
| Total Cash Costs + Depreciation Costse | Culls | $144.46 | 0.04 |
| Total Costf,g | Large | $30,853.45 | 2.57 |
| Total Costf,g | Medium | $9,365.44 | 2.34 |
| Total Costf,g | Small | $389.50 | 1.95 |
| Total Costf,g | Culls | $166.30 | 0.04 |
Notes: This table shows break-even returns for different levels of total enterprise cost. For each cost level, there are four break-even returns—one for each sweet cherry size—and they should be viewed as a group that occurs together. The enterprise breaks even only when all four returns are achieved at the same time. The break-even returns are calculated by sharing total costs across cherry sizes based on their contribution to total returns: about 75.6% for large cherries, 22.9% for medium, 1.0% for small, and 0.4% for Cull. These return shares reflect the assumed mix of cherry sizes produced, which is approximately 60% large, 20% medium, 1% small, and 19% Cull of total production.
a The break-even return per size is obtained as follows: proportional cost divided by the production of each cherry size.
b If the return is below this level, sweet cherries are uneconomical to produce.
c If there are other cash costs on an individual’s orchard, these costs must be identified and included in the cash cost break-even return calculation.
d The second break-even return allows the producer to stay in business in the short run.
e The third break-even return allows the producer to stay in business in the long run.
f Total cost includes interest costs, which consist of both interest on owned capital and actual cash interest payments on borrowed funds. Interest costs include some actual cash interest payments.
g The fourth break-even return is the total cost break-even return. Only when this break-even return is received can the grower recover all out-of-pocket expenses plus opportunity costs.
At the total cost level, break-even prices are $2.57/lb for large cherries, $2.34/lb for medium cherries, $1.95/lb for small cherries, and $0.04/lb for culls, compared with $2.14/lb, $1.95/lb, $1.62/lb, and $0.04/lb, respectively, at the variable cost level. These break-even values are derived by allocating total enterprise costs across sizes according to their contribution to total returns—approximately 75.7% for large cherries, 23.0% for medium cherries, 1.0% for small cherries, and 0.4% for culls. These return shares reflect the assumed production and price structure presented in Table 4, where gross production is distributed as 60% large, 20% medium, 1% small, and 19% cull fruit. As a result, sizes accounting for a larger share of total revenue absorb a larger share of total enterprise costs and therefore require higher break-even returns per pound.
Table 4 presents the underlying baseline assumptions used to compute these thresholds, including the 20,000 lb/acre gross production, the specified size distribution, and the harvest, packing, overhead (5%), and interest (5%) parameters that can be adjusted to evaluate sensitivity in break-even outcomes.
| Variables | Value |
|---|---|
| Gross production | 20,000 |
| Size distribution: Large, % of gross productiona | 60% |
| Size distribution: Medium, % of gross productiona | 20% |
| Size distribution: Small, % of gross productiona | 1% |
| Size distribution: Cull, % of gross productiona | 19% |
| FOB price ($/lb), large | $2.35 |
| FOB price ($/lb), medium | $2.14 |
| FOB price ($/lb), small | $1.78 |
| FOB price ($/lb), cull | $0.04 |
| Picking labor cost ($/lb) | $0.24 |
| Other harvest labor cost ($/lb)b | $0.15 |
| Hauling cost ($/lb) | $0.05 |
| Packing charges ($/lb) | $0.85 |
| Overhead (%) | 5% |
| Interest rate (%) | 5% |
Notes: These are baseline values. Changing values in Table 4 in the Excel workbook will automatically update the numbers shown in Table 3.
a Important note: When changing the percentages of size distribution, they must sum up to 100%.
b Refers to checking, tractor drivers, and supervisors.
Most of the budget values given in Table 2 are based on more comprehensive underlying cost data, which are shown in tables in Appendix A, Tables A1 to A4. Appendix A presents the annual capital requirements for a 12-acre, late-season mahogany sweet cherry block. Appendix A, Table A2, specifies the machinery and building requirements for the 300-acre multi-crop cultivar orchard. Interest costs are listed in Appendix A, Table A3, and depreciation costs are in Appendix A, Table A4. Interest costs represent the required return on investments. They can be actual interest payments on funds borrowed to finance farm operations and physical capital investments, an opportunity cost (a return that would have been received if the investment had been in an alternative activity), or a combination of the two. All interest and amortization costs assume a 5% interest rate. The amortized establishment costs assume a total productive life of 25 years, which includes 5 years of establishment and 20 years of full production. The amortized establishment costs must be recaptured during the full production years in order for an enterprise to be profitable. Depreciation costs are annual, noncash expenses that are calculated over the asset’s useful life. These expenses represent the loss in an asset’s value due to use, age, and obsolescence.
The key results of this enterprise budget are formed by production-related assumptions established for the study. Production costs and returns for individual owner-operators may differ; thus, the results cannot be generalized to represent the population of sweet cherry operations in Washington State. An interactive Excel Workbook, described below, is provided to enable individual owner-operators to estimate their returns based on the costs of their production.
Excel Workbook
An Excel spreadsheet version of the 2026 enterprise budget (Table 2) as well as associated data underlying the per-acre cost calculations (Appendix Tables A5 through A9 for establishment costs, full production costs, calculation of salvage value and depreciation costs, amortization calculator, all production-related data for the late-season mahogany sweet cherry orchard investment) are available at the WSU School of Economic Sciences Extension website.
Owner-operators can modify select values and thus use the Excel Workbook to evaluate their own production costs and returns.
Acknowledgements
The authors acknowledge the information provided by a group of anonymous late-season mahogany sweet cherry orchard and packinghouse owner-operators, pesticide consultants, nursery representatives, financial institution representatives, and WSU Extension educators.
Appendix A
| Requirements and Receipts | Year 1 | Year 2 | Year 3 | Year 4 | Year 5 | Years 6–25 (Full Production, Annual Average) |
|---|---|---|---|---|---|---|
| Land (12 acres) | 216,000 | - | - | - | - | - |
| Trellis system | 38,500 | - | - | - | - | - |
| Reflective cover | - | - | - | - | - | - |
| Netting | - | - | - | - | - | - |
| Irrigation system | 42,147 | - | - | - | - | - |
| Main line & pump | 0 | - | - | - | - | - |
| Pond | 0 | - | - | - | - | - |
| Wind machine | - | - | 43,500 | - | - | - |
| Operating expensesa | 169,292 | 53,517 | 127,242 | 340,955 | 400,520 | 388,750 |
| Total requirements ($) | 465,938 | 53,517 | 170,742 | 340,955 | 400,520 | 388,750 |
| Receipts ($) | 0 | 0 | 71,741 | 327,958 | 409,948 | 409,948 |
| Net requirements ($) | 465,938 | 53,517 | 99,002 | 12,996 | -9,428 | -21,198 |
Notes: The full production year is representative of all the remaining years the orchard is in full production (Year 6 to Year 25).
a Operating expenses is the sum of the total variable costs, miscellaneous supplies, land and property taxes, insurance cost, and management cost.
| Requirements | Description | Purchase Price ($)a | Number of Units | Total Cost ($) |
|---|---|---|---|---|
| Machine shop/shedb | - | 150,000 | 1 | 150,000 |
| Tractor-70HP, 4WD | 70HP, 4WD | 65,000 | 5 | 325,000 |
| Tractor-40HP, 4WD | 40HP, 4WD | 60,000 | 2 | 120,000 |
| 4-wheeler | 2WD | 8,000 | 3 | 24,000 |
| Speed sprayer | - | 30,000 | 5 | 150,000 |
| Weed spray boom & tank | - | 7,000 | 1 | 7,000 |
| Mower-rotary | 7 ft | 7,800 | 1 | 7,800 |
| Flail mower | - | 12,000 | 1 | 12,000 |
| Fork lift | - | 50,000 | 2 | 100,000 |
| Bin trailer | - | 11,000 | 4 | 44,000 |
| Pickup truck | Full size | 65,000 | 2 | 130,000 |
| Ladder | 8 ft | 120 | 100 | 12,000 |
| Platforms | - | 60,000 | 3 | 180,000 |
| Miscellaneous equipmentc | - | 50,000 | 1 | 50,000 |
| Shop equipmentd | - | 20,000 | 1 | 20,000 |
| Total Cost | - | - | - | 1,331,800 |
Notes: Machinery, equipment, and buildings are utilized in growing diverse crops in the 300-acre farm, which includes late-season mahogany sweet cherries. The costs of fixed capital are allocated on the entire farm operation.
a Purchase price corresponds to new machinery, equipment, or building.
b Includes manager office, restroom, pesticide handling area and storage, dry storage, area for equipment cover, and shop bay for equipment work/repair.
c Includes mobile portable toilet (2), box blade, straight blade, quick connect loader, mechanical weeder, detachable bucket for loading fertilizer, gopher baiter, soil aerator, utility trailer, and ladder trailer (2).
d Includes compressor, welder, pressure washer, and miscellaneous tools.
| Capital Requirements | Total Purchase Price ($) | Salvage Value ($)a | Number of Acres | Total Interest Cost ($) | Interest Cost per Acre ($)b |
|---|---|---|---|---|---|
| Irrigation systemc | 42,147 | 0 | 11 | 1,054 | 96 |
| Reflective coverc | 0 | 0 | 11 | 0 | 0 |
| Nettingc | 0 | 0 | 11 | 0 | 0 |
| Land | 216,000 | N/A | 12 | 10,800 | 900 |
| Machinery, equipment & buildingd,e | 1,331,800 | 118,180 | 300 | 36,250 | 121 |
| Main line & pumpc | 0 | 0 | 11 | 0 | 0 |
| Pondc | 0 | 0 | 11 | 0 | 0 |
| Trellisc | 38,500 | 0 | 11 | 963 | 88 |
| Wind machinec | 43,500 | 0 | 11 | 1,088 | 99 |
a Not applied to land because land is not a depreciable asset.
b Interest Cost is calculated as: (Total Purchase Price + Salvage Value) ÷ 2 × Interest Rate. For land, the calculation is: Total Purchase Price × Interest Rate, because there is no salvage value for land.
c The irrigation system, reflective cover, netting, main line and pump, pond, trellis system, and wind machine are used for the direct production of the fruit. Hence, their respective interest costs are divided by the production area (11 acres) to get the interest cost per acre.
d Total area of the farm operation is 300 acres, and the machinery, equipment, and building are used in the entire, diverse cultivar farm. Thus, the corresponding interest costs are divided by the total area (300 acres) to derive the interest cost per acre.
e See Appendix A, Table A7, in the Excel Workbook for a detailed calculation of the salvage value of the machinery, equipment, and building.
| Capital Requirements | Total Purchase Price ($) | Number of Acres | Total Value per Acre ($) | Years of Useful Life | Depreciation Cost per Acre ($/yr)a |
|---|---|---|---|---|---|
| Irrigation system | 42,147 | 11 | 3,832 | 30 | 128 |
| Reflective cover | 0 | 11 | 0 | 10 | 0 |
| Netting | 0 | 11 | 0 | 20 | 0 |
| Main line & pump | 0 | 11 | 0 | 30 | 0 |
| Pond | 0 | 11 | 0 | 50 | 0 |
| Trellis | 38,500 | 11 | 3,500 | 25 | 140 |
| Wind machine | 43,500 | 11 | 3,955 | 30 | 132 |
| Machinery, equipment, & buildingb | - | - | - | - | 378 |
a The depreciation cost is calculated as straight-line depreciation: (Total Purchase Price − Salvage Value) ÷ Years of Use.
b See Appendix A, Table A7, in the Excel Workbook for a detailed calculation of the depreciation cost of the machinery, equipment, and building.
References
USDA National Agricultural Statistics Service (NASS). 2025. 2024 State Agriculture Overview. Washington.
Van Well Nursery. 2026. Cherries Harvest Dates for Central Washington.
WSTFA (Washington State Tree Fruit Association). 2026. Shipment and FOB price sweet cherry data 2021–2025.
WSU Tree Fruit (Washington State University Tree Fruit. Comprehensive Tree Fruit Site). 2026. Varieties. Sweet Cherry.
R. Karina Gallardo, Professor and Extension Specialist, School of Economic Sciences, Puyallup Research and Extension Center, Center for Precision and Automated Agricultural Systems, Washington State University
Suzette P. Galinato, Associate Professor and Extension Specialist, Agricultural Economics Agriculture and Natural Resources, Washington State University Extension
Bernardita Sallato C., Associate Professor and Tree Fruit Extension Specialist, Irrigated Agriculture Research and Extension Center, Washington State University
Photos by B. Sallato.

TB115E

Copyright © Washington State University
WSU Extension publications contain material written and produced for public distribution. Alternative text descriptions for select complex images were generated using ChatGPT (OpenAI), then reviewed and adapted to ensure compliance with Web Content Accessibility Guidelines (WCAG) accessibility standards.
Issued by Washington State University Extension and the US Department of Agriculture in furtherance of the Acts of May 8 and June 30, 1914. Extension programs and policies are consistent with federal and state laws and regulations on nondiscrimination regarding race, sex, religion, age, color, creed, and national or ethnic origin; physical, mental, or sensory disability; marital status or sexual orientation; and status as a Vietnam-era or disabled veteran. Evidence of noncompliance may be reported through your local WSU Extension office. Trade names have been used to simplify information; no endorsement is intended.