Vineyard Nutrient Management in Washington State
Description
Understanding the nutrient requirements of perennial fruit crops is paramount to the longevity and sustainability of a commercial operation. This guide provides basic information on grape plant nutrition and management.
Table of Contents
- Overview
- Nutrient Types
- Nutrient Abbreviations
- Introduction to Vine Nutrition
- Soil Fertility and Plant Nutrient Availability
-
Testing for Nutritional Deficiencies
- Soil versus Tissue Testing
Overview
Understanding the nutrient requirements of perennial fruit crops is paramount to the longevity and sustainability of a commercial operation. This guide provides basic information on grape plant nutritional requirements, and how those nutrients become available for use. It also provides specific information relating to vineyards; how site, soil, and viticulture practices influence nutrient uptake. Information on how to soil and tissue test for vine nutrient status is described, as well as specific recommendations for correcting nutrient deficiencies, broken down by the key macro- and micronutrients required by grapevines.
Nutrient Types
Macronutrients (nitrogen, phosphorus, potassium, calcium, sulfur, and magnesium) are used in relatively large quantities by vines.
Micronutrients (zinc, boron, iron, manganese, molybdenum, nickel, and chlorine) are required in very small amounts.
Nutrient Abbreviations
B: boron (BO33+)
Ca: calcium (Ca2+)
Cl: chlorine (C1–)
Fe: iron (Fe2+)
K: potassium (K+)
Mg: magnesium (Mg2+)
Mn: manganese (Mn2+)
Mo: molybdenum (Mo+)
Na: sodium (Na+)
Ni: nickel (Ni2+)
P: phosphorus (PO43- )
N: nitrogen (NO3–, NH4+)
S: sulfur (SO42-)
Zn: zinc (Zn2+)
Introduction to Vine Nutrition
Grapevines require sixteen essential nutrients for growth and development. Some, such as carbon (C), hydrogen (H), and oxygen (O), are acquired through the absorption of carbon dioxide or water uptake. The remaining thirteen nutrients are predominantly acquired from the soil. Due to their roles in plant development, a deficiency in any of these nutrients can lead to reduced vine vigor and fruit set, impaired photosynthesis, diminished fruit quality, and if the deficiency is severe or chronic, vine death.
Perennial parts of the vine such as trunks, cordons, and coarse roots act as sources of nutrients at the beginning of each season. In the fall, nutrients are stored in these tissues for the following year’s early growth. Annual parts of the vine such as leaves and fine roots are the greatest driver of nutrient demand in the grape plant and obtain their nutrients from reserves translocated from permanent structures and/or from soil uptake. The majority of nutrient uptake from soil typically occurs between bloom and véraison in both wine and juice grapes. However, differences in the timing of nutrient uptake can vary greatly depending on the cultivar, weather, vine age, and crop levels (Schreiner et al. 2006; Pradubsuk and Davenport 2010, 2011).
In a natural setting, nutrients are recycled through the decomposition of fallen leaves and shredded debris. In production systems, however, nutrients are lost due to the harvesting of fruit as well as nutrient leaching and runoff. Thus, mature vineyards require periodic treatments with one or more nutrients; these treatments may or may not be required annually, depending on plant use and site availability.
Soil Fertility and Plant Nutrient Availability
Plants take up nutrients via their roots as positively or negatively charged ions, which are soluble in water. Nutrients also exist in many other forms in the soil; however, these are not directly available to plants as they are insoluble. These nutrients only become available to plants once they have been converted from insoluble to soluble forms that can then be dissolved in soil solution. This occurs through the weathering of minerals present in the soil, and the decomposition of organic matter by soil organisms. Weathering is a very slow process that releases only small amounts of nutrients in any given year. Other factors influencing soil-derived nutrients are highlighted in Table 1.
| Factor | What It Does | Practical Implications |
|---|---|---|
| Water | Insufficient water will prevent nutrients from dissolving, making them unavailable to plants. A lack of water will also reduce the activity of soil microorganisms which will slow down the decomposition of organic matter. Excessive amounts of water can cause leaching of nutrients from the root zone. In contrast, when soils are waterlogged for great amounts of time some nutrients can accumulate in toxic forms in the soil. | In the case of irrigated vineyards, water quality can also impact plant nutrition by providing an unanticipated source of nutrients or altering soil pH. Prior to use, groundwater (well water) should always be tested by a qualified lab for pH, electrical conductivity, and levels of Na, Ca, Mg, K, N, S, and carbonate/bicarbonate. |
| Temperature | Grape roots typically do not take up nutrients until the soil temperature has reached and maintains at 55°F. Decreases in soil temperature reduce the activity of soil microorganisms. Low temperatures will slow the rate at which organic matter is decomposed and will cause a decline in the release of plant-available nutrients. Increased temperatures can accelerate this reaction, causing increased release of nitrogen from the soil matrix. | Certain forms of nitrogen (ammonia) can be subject to volatilization, the conversion from a dissolved form to ammonia gas, which can reduce the nutrient in the vineyard. |
| pH | Soil pH influences the availability of macro and micronutrients (Figure 1). Most macronutrients become less available when soil pH is below 6.0 (acidic). Most micronutrients (with the exception of molybdenum) become less available as pH increases. Activity of soil microorganisms suffers when soil conditions are either too acidic or basic. | Soils tend to be naturally acidic in high rainfall areas (e.g., much of Washington west of the Cascades) and are neutral to alkaline in drier areas (e.g., much of Washington east of the Cascades). Modification of soil pH through the application of calcium carbonate or dolomitic lime to approximately 6.5 to 6.8 allows for the highest nutrient availability and is optimum for the growth of grapevines (Figure 1). |
| Cation exchange capacity | A soil’s cation exchange capacity (CEC) is its ability to hold onto (adsorb) and release nutrients present as positively charged ions (cations), such as K, Ca, Mg, and Na. As plants take up nutrients, those adsorbed to the soil are released into the soil water as replacements. | Soils that are high in clay and/or organic matter exhibit high CEC while sandy soils low in organic matter exhibit low CEC. The addition of organic matter can increase a soil’s nutrient exchange ability. |
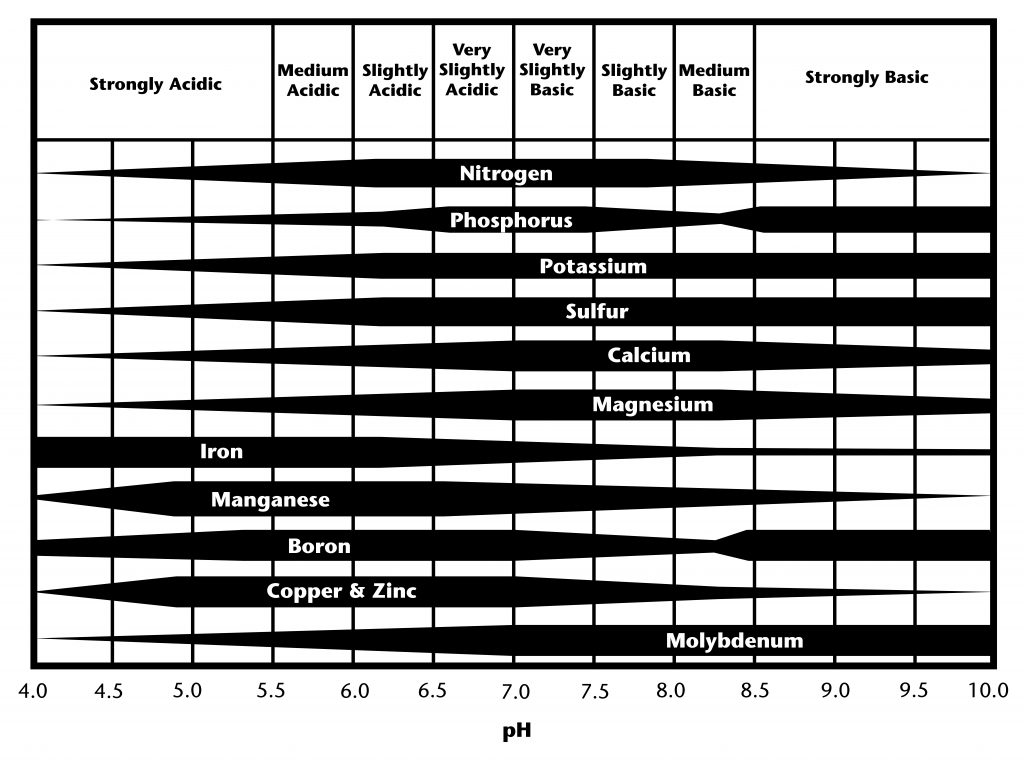
Figure 1 is a horizontal chart illustrating soil nutrient availability across soil pH levels from 4.0 to 10.0. The pH scale is labeled from strongly acidic on the left to strongly basic on the right, with neutral pH at approximately 7.0.
Each nutrient is represented by a horizontal band whose thickness indicates relative availability at different pH levels. Nitrogen, phosphorus, potassium, sulfur, calcium, and magnesium show greatest availability in the slightly acidic to slightly basic range, centered around pH 6.0 to 7.5. Calcium and magnesium increase in availability as pH becomes neutral to moderately basic.
Micronutrients iron, manganese, boron, copper, and zinc are most available under acidic conditions and decrease sharply as pH increases. In contrast, molybdenum shows low availability in acidic soils and increases steadily toward alkaline conditions.
Overall, the chart demonstrates that most essential plant nutrients are optimally available in soils with near-neutral pH, while acidic or strongly basic conditions reduce availability of specific nutrients.
Testing for Nutritional Deficiencies
Soil versus Tissue Testing
Vine nutrient management begins before the plants are in the ground. Before planting, soil tests can be used to determine whether lime or other soil amendments are required. It is easier to amend vineyard soils prior to planting than once the vineyard has been established. Initial soil samples should be analyzed for nutrient status (deficits or excesses), pH, cation exchange capacity, and organic matter.
In established vineyards, soil tests are of limited benefit when evaluating nutrient requirements as they only indicate relative availability. Since the level of availability of a particular nutrient in the soil is not always indicative of the nutrient status of the vines, it is recommended that growers use annual tissue tests to determine the concentration of nutrients within the plants.
To develop the most effective vineyard fertilizer plan, these annual tissue tests should be coupled with the occasional soil test (every 3 to 5 years at the same time of year) for nutrient availability, Ph, and other chemistry, including salinity. The occasional, post-planting soil test is useful in determining how management practices may be changing soil conditions. For example, repeated applications of organic materials (e.g., compost or manure) often result in the buildup of one or more nutrients. In some cases this can lead to excess nutrient or salt availability and toxicity. If you are routinely soil testing, this can be monitored for over time. Unfortunately, in irrigated areas, drip irrigation causes variation in soil moisture, root activity, and nutrient concentration. This makes it difficult to collect a soil sample reflective of root zone conditions. Growers with drip-irrigated vineyards should rely more heavily on tissue testing than growers with sprinkler / overhead irrigation.
In Washington State, whole leaves (Figure 2) should be used for tissue testing. In other regions of the United States, petioles alone are often used for tissue testing. Studies have shown that in the Pacific Northwest, using only petioles results in an over recommendation of nitrogen fertilizer in irrigated vineyards (Davenport et al. 2012). In vineyards with adequate canopy growth and sustainable crop yield, less than 10% of wine grape petioles were in the “adequate” range for nitrate nitrogen (NO3-N) at both bloom and véraison (when grape ripening begins, with sampling between 30% and 50% véraison) compared to California petiole standards for grapes (Christensen 1969, 1984; Davenport et al. 2012).
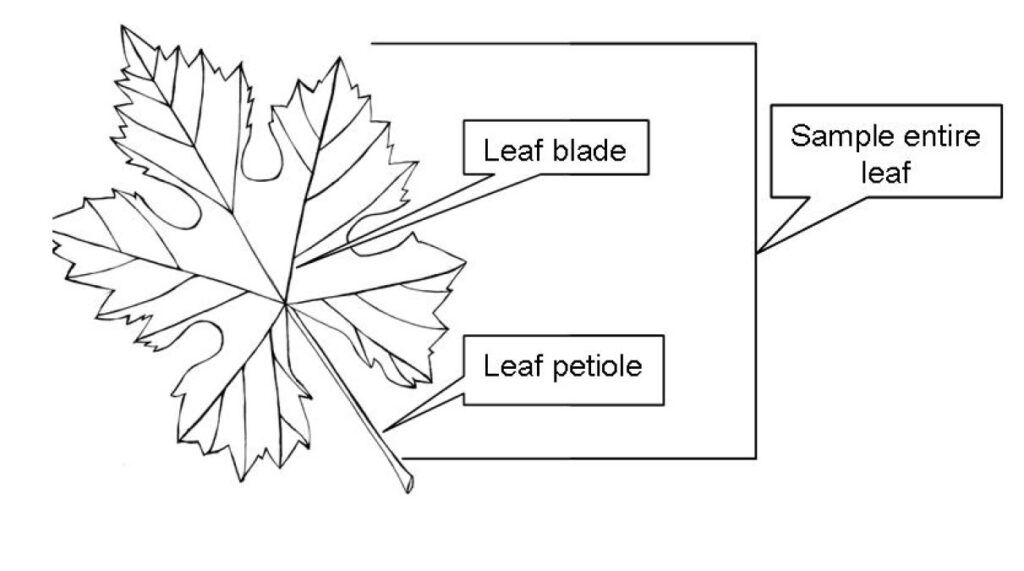
Callout labels identify two main parts of the leaf: the leaf blade, which includes the broad, flat, lobed portion, and the leaf petiole, the narrow stalk connecting the blade to the stem. A bracket and callout on the right side indicate that the entire leaf—including both the blade and the petiole—should be sampled. The diagram is instructional and intended to show which leaf parts are included when collecting a whole-leaf sample.
However, when whole leaf tissue nitrogen values from those same vineyards were compared to those recommended in other regions (e.g., Australia) (Weir and Cresswell 1993), the tissue was in the adequate range.
The timing of tissue sampling is important in irrigated Pacific Northwest vineyards. At bloom, changes in leaf tissue nutrient concentration take place on a regular basis whereas nutrient concentration at véraison tends to remain stable.
Because of this stability, véraison samples are recommended over samples taken at bloom. However, taking a sample at both bloom and véraison can be useful when used together to develop a management plan. For example, if you had a deficiency last season (noted with véraison tissue testing), a test at bloom may help to determine if there is still a deficiency, which can likely still be corrected early in that season.
Interpretation of Results
In established vineyards, the physical appearance of vines should also be taken into consideration when determining if there is a nutrient deficiency (Davenport 2013; Skinkis and Schreiner 2011). Observations of nutrient deficiency symptoms (foliage discoloration, reduction in yield, vigor) can yield important clues regarding nutrient status. However, a true nutrient deficiency or toxicity must be determined through the combination of symptom observation and test results.
This is because some nutrient deficiency symptoms are also similar to symptoms resulting from non-nutritional causes, such as herbicide toxicity or disease. Furthermore, a lack of visible symptoms is not foolproof evidence that no deficiencies exist, as routine annual tissue testing will often detect mild deficiencies prior to symptoms becoming visible.
When developing a remediation program for grapevine nutritional deficiencies, nutrient adjustments should be modest and vine vigor and crop load should be considered. Another consideration when adding or reducing fertilizers is that some nutrient concentrations are difficult to change with a single fertilizer adjustment. It may take several years of corrective action for some nutrients to achieve desired results. Other nutrient responses can be immediate.
Some confusion can arise when comparing the results from both soil and tissue tests taken at the same vineyard. Figure 3 illustrates how the results from both tests can be combined and interpreted.
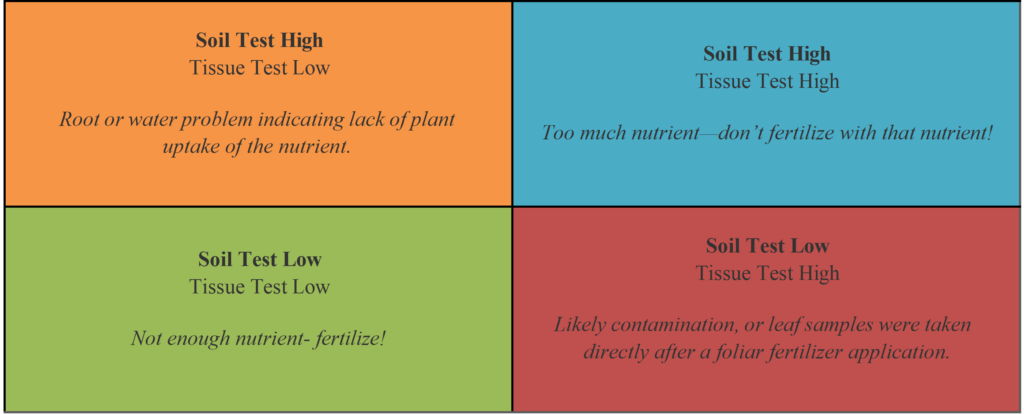
Top left quadrant (orange): “Soil Test High, Tissue Test Low,” indicating a root or water problem limiting plant nutrient uptake. Top right quadrant (blue): “Soil Test High, Tissue Test High,” indicating excess nutrient—do not fertilize with that nutrient. Bottom left quadrant (green): “Soil Test Low, Tissue Test Low,” indicating insufficient nutrient—fertilize. Bottom right quadrant (red): “Soil Test Low, Tissue Test High,” indicating likely sample contamination or tissue collected soon after a foliar fertilizer application.
The best way to interpret and respond to nutrient analysis is to measure long-term trends in a location. Both soil and tissue test results should be graphed and compared to see if there are changes in nutrient status over time. Results from tissue tests performed on samples from the same growth stage, as well as soil tests, can also be used to determine if your nutrition regime is working. To do this, create a simple graph using data processing software (e.g., Excel), and compare the test results to records of vine growth, yield, or fruit/wine quality. This will allow you to determine how effective changes to your fertilization routine have been. These comparisons over multiple sampling periods (seasons or years) also help prevent over-reaction to an individual test result, as variation in nutrient concentrations can occur for a number of reasons, including the weather, plant growth, yield, and recent applications of pesticides containing particular micronutrients.
An example of changes in tissue boron levels are shown in Figure 4. This figure also demonstrates how a grower can interpret nutrient test results over time and in relationship to when fertilizers are added. In Figure 4, leaf boron content can fall from acceptable ranges into deficiency ranges, resulting in decline in yields. One can also see the positive result of a boron fertilizer application in both an increase in tissue content and in increased yield.
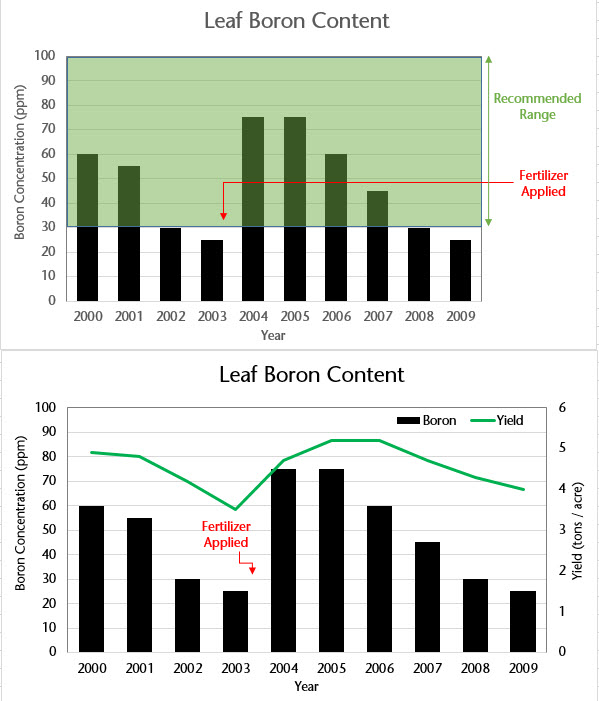
The image contains two related bar charts, one above the other, both labeled “Leaf Boron Content” and covering the years 2000 through 2009 on the horizontal axis. In both charts, the left vertical axis shows boron concentration in parts per million (ppm).
In the top chart, black bars represent leaf boron concentration each year. A shaded green band spans roughly from 30 to 100 ppm, labeled on the right as the “Recommended Range.” Early years (2000–2001) show boron levels around 55–60 ppm, followed by a decline to about 25–30 ppm by 2002–2003, dipping below or near the lower edge of the recommended range. A red horizontal line and arrow labeled “Fertilizer Applied” mark a fertilizer application around 2003. After this point, boron levels increase sharply in 2004 and 2005 to around 75 ppm, then gradually decline again through 2009, ending near 25 ppm.
The bottom chart repeats the boron concentration bars but adds a second vertical axis on the right showing yield (tons per acre). A green line represents yield over time. Yield is relatively high in 2000–2001, declines to its lowest point around 2003 (coinciding with low boron levels), then increases sharply after the fertilizer application in 2004–2006, before gradually decreasing again toward 2009. A red arrow and label again indicate “Fertilizer Applied” near 2003, visually linking the increase in boron concentration with improved yield in subsequent years.
Together, the charts illustrate the relationship between leaf boron concentration, fertilizer application, recommended nutrient ranges, and crop yield over time.
Soil Test Results
Results of soil tests are generally accompanied by an interpretation from the lab that carried out the tests (See the sidebar Interpreting a Soil Test Report). Additional guidelines for interpretation are found under each specific nutrient later in this guide. Test results indicate the concentration of each nutrient in your sample and are expressed as either parts per million (ppm), as a percentage, or as milliequivalents. Sometimes the interpretation of deficiency or sufficiency is based on vine requirements, but sometimes it is not. Be sure to clarify what crop the company performing the analysis used to establish the baseline recommendations for these nutrients.
Interpreting a Soil Test Report
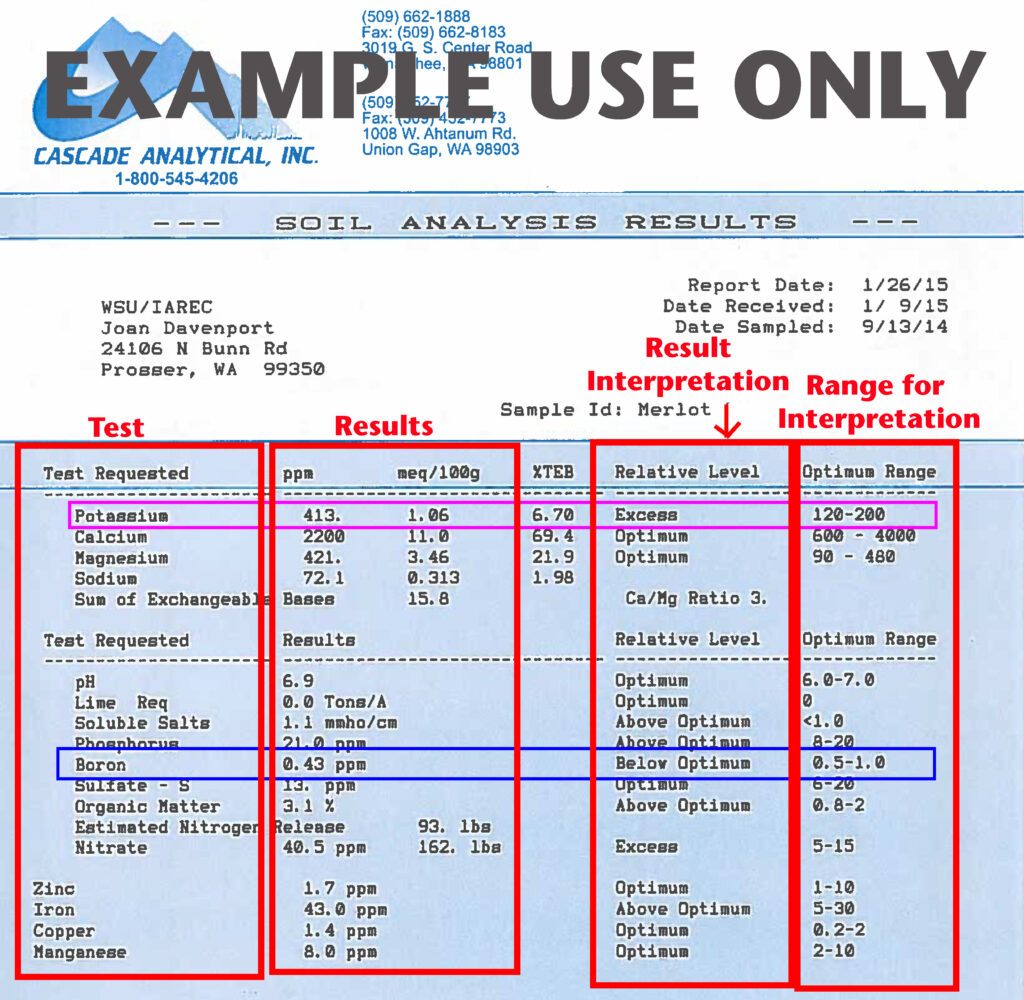
This is an example of a commercial soil test report. Most reports will include a list of the tests ordered, what the actual test results are, the interpretation of the results, and what ranges of soil nutrients the company used to interpret the results. Potassium, for example (purple box), is listed in excess and is more than double the optimal range. This would suggest that additional potassium is not needed for this site. Boron (blue box), however, is just below the optimal range. If this were a new site, it might indicate that soil-applied boron would be appropriate in the site preparation regime. If this is from an established site, one would couple these tests results with a tissue test and visual symptoms to see if boron is deficient. If fruit set is poor and tissue tests also indicate a deficiency, a short-term remedy of a foliar application may be warranted. If symptoms of deficiency are not present, and tissue tests do not indicate a deficiency either, immediate remediation may not be necessary.
The image shows a scanned soil analysis report labeled “EXAMPLE USE ONLY” across the top. The report is from Cascade Analytical, Inc., with contact information and addresses printed at the top left and center. The title “SOIL ANALYSIS RESULTS” appears near the top of the page. The client information lists WSU/IAREC and an address in Prosser, Washington. On the right side, report metadata includes the report date, date received, and date sampled, along with a sample ID labeled “Merlot I.”
The main body of the report is a table divided into several vertical sections that are emphasized with thick red outlines and labels added for instructional purposes. From left to right, these sections are labeled “Test,” “Results,” “Result Interpretation,” and “Range for Interpretation.”
The leftmost column, labeled “Test Requested,” lists nutrients and soil properties such as potassium, calcium, magnesium, sodium, pH, lime requirement, soluble salts, phosphorus, boron, sulfate-sulfur, organic matter, estimated nitrogen release, nitrate, zinc, iron, copper, and manganese. Potassium is highlighted with a purple box, and boron is highlighted with a blue box to draw attention to those specific nutrients.
The “Results” column shows numerical values for each test, often in parts per million (ppm), milliequivalents per 100 grams (meq/100g), or other relevant units. For example, potassium is shown as 413 ppm, calcium as 2200 ppm, and boron as 0.43 ppm.
The “Result Interpretation” column classifies each result using qualitative terms such as “Excess,” “Optimum,” “Above Optimum,” or “Below Optimum.” Potassium is labeled “Excess,” while boron is labeled “Below Optimum,” indicating a deficiency relative to recommended levels.
The rightmost column, labeled “Optimum Range,” lists recommended ranges for each nutrient. For example, potassium has an optimum range of 120–200 ppm, and boron has an optimum range of 0.5–1.0 ppm. These ranges explain why potassium is interpreted as excessive and boron as below optimum.
Overall, the image serves as an instructional example showing how to read a soil test report, identify measured values, understand their interpretations, and compare them against recommended nutrient ranges.
Tissue Test Results
Results from tissue tests may or may not come with an interpretation. Additional guidelines for interpretation are found under each specific nutrient later in this guide. In the case of tissue tests, if one or more nutrient concentration is outside of the normal range following véraison sampling, growers may either decide to wait and re-test at bloom the following year to ensure the result was not an anomaly, or make small changes to the fertilization program in an attempt to correct it. If any tissue or soil nutrient concentrations are found to be significantly higher or lower than their normal range, an Extension specialist should be contacted.
Resources for Finding a Testing Laboratory
When choosing a testing lab, it is best to work with a single lab for both your tissue and soil sample analysis. Select labs that use traditional, calibrated techniques for soil nutrient testing. While there are an increasing number of labs that conduct a soil health evaluation, that type of evaluation differs from the testing for nutrient management.
A quality test lab will be part of a proficiency testing program. This participation is for quality assurance; the lab receives and analyzes standardized soil (and possibly plant tissue) samples at least once a year to ensure that their analysis is within the expected range of nutrients. The most common programs in the US are the NAPT (North American Proficiency Testing) and ALP (Agricultural Lab Proficiency Program). If the lab you would like to use does not indicate membership in one of these programs on their website, call and ask them if they are part of a proficiency testing program. If they are not, do not use the lab.
It is also best to use a lab that is local to your area. In Washington, the majority of the test labs are in eastern Washington and typically run tests specific to this region. Make certain you specify your geographic region as soils from western Washington often are prepared differently to reflect the soil pH and climatic factors that influence soil chemistry.
A database of accredited testing facilities can be found at the WSU Viticulture and Enology website.
How to Collect Soil Samples for Nutrient Analyses in Vineyards
Soil samples that are representative of the area to be planted can be collected randomly throughout the vineyard when the soil is moist (e.g., in the fall) with either a cylindrical probe or a shovel. Sampling strategies are described in Staben et al. (2003). In irrigated eastern Washington, research has shown that a single soil sampling depth range of 0 to 18 inches is appropriate for collecting soil cores. In rain-fed western Washington, nutrient availability and pH levels can be very different depending on the depth of the soil, so two soil sample depths per each sampling location is recommended: one that is from 0 to 8 inches deep and one that is from 8 to 16 inches deep. Grapevine roots can grow deeper than 18 inches in loose soils, but altering soil characteristics below this depth is difficult. Each sample should include approximately 1 pound of soil, comprising 10 to 20 subsamples that have been thoroughly mixed and are free of large pebbles, sod, and surface litter. In rain-fed western Washington, nutrient availability and pH levels can be very different depending on the depth of the soil, so two soil sample depths per each sampling location is recommended: one that is from 0 to 8 inches deep and one that is from 8 to 16 inches deep. Grapevine roots can grow deeper than 18 inches in loose soils, but altering soil characteristics below this depth is difficult. Each sample should include approximately 1 pound of soil, comprising 10 to 20 subsamples that have been thoroughly mixed and are free of large pebbles, sod, and surface litter.
In drip-irrigated vineyards, soil samples should be collected from an area that is between a drip emitter and vine trunk, but not directly under the dripline (Figure 5). The area under the drip emitter is not representative of the water flow patterns available to plant roots. Soil samples are good indicators of soil organic matter content, soil pH, and cation exchange capacity. Reports from previous years can be used to determine long-term trends in changes in soil properties and nutrients.
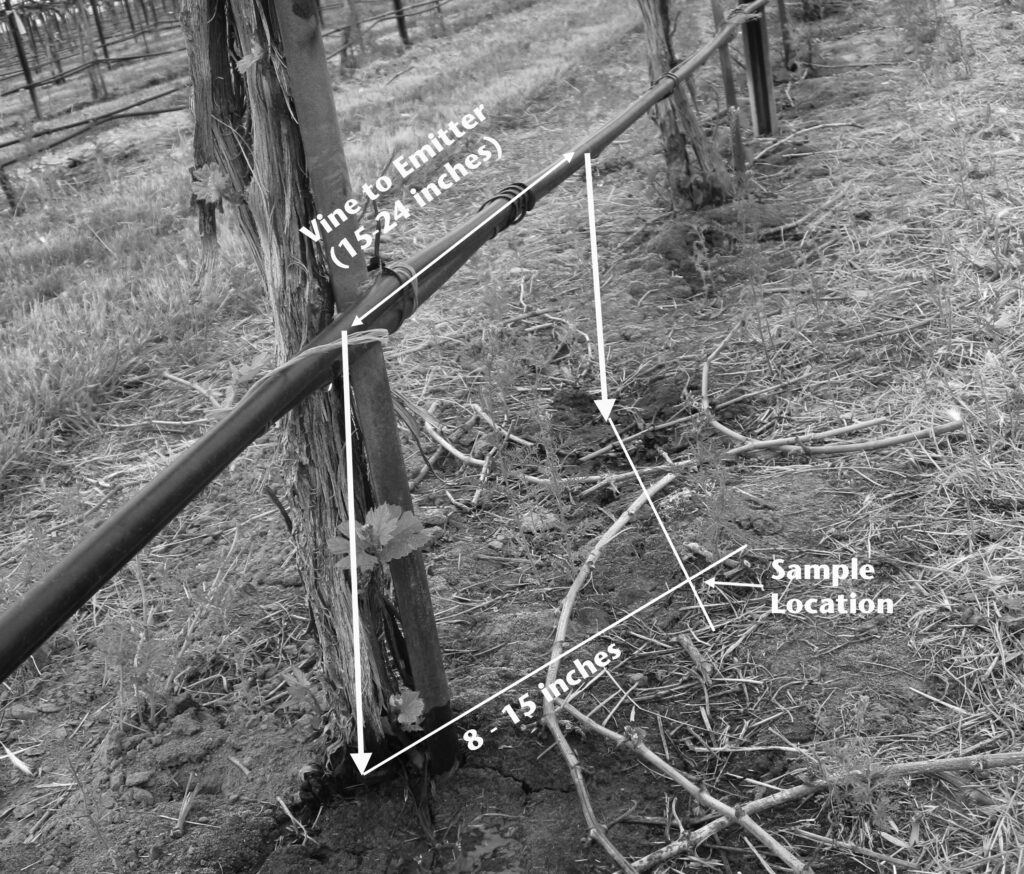
The image shows a black-and-white photograph of a vineyard row with grapevines trained along a trellis system. A drip irrigation line runs horizontally along the row and is attached to the vine trunk. White arrows and labels overlay the image to illustrate measurement distances used for soil sampling. One label indicates the distance from the vine trunk to the irrigation emitter, marked as 15–24 inches along the drip line. Another arrow points downward from the emitter to the ground, showing the approximate vertical drop to the soil surface. A diagonal arrow on the ground marks a distance of 8–15 inches from the vine trunk to the designated soil “Sample location,” which is labeled near the soil surface. The ground beneath the vines is bare with scattered plant debris, emphasizing the sampling area relative to the vine and irrigation system.
How to Collect Grape Leaves for Nutrient Analyses
The guidelines here cover whole leaf samples taken at bloom and véraison because both yield meaningful results when used together (Table 2).
Sampling strategies: In blocks 2 acres or smaller, collect a minimum of 50 leaves. For blocks larger than 2 acres, collect 25 leaves per acre up to a maximum of 300 leaves per block. Ensure that sampling takes place equally from both sides of the canopy and in a random pattern within the vineyard using either pre-determined sampling points such as row or vine numbers or a GPS with pre-set waypoints. If sampling from vines near the end of the row, try to skip the first three vines to avoid any potential “edge effect” that is often associated with changes in water or soil conditions near the edges of vineyards. Collect samples from vines that are representative of the entire block, are well exposed to sunlight, and do not exhibit any physical injuries or disease.
If any vines exhibit unusual vigor or growth restrictions, analyze leaf samples from these vines separately. Sample different varieties independently if there are more than one in a block. If there is a small number of vines exhibiting a deficiency symptom, collect a minimum of 25 leaves from the affected vines to give the lab enough tissue for analytical purposes. Also, it is better to collect healthy, unaffected leaves from these symptomatic vines if possible.
Once your leaves have been collected, place the sample (all leaves from the sampling area) immediately in a paper bag. Label the bag with the grape variety, the date the leaves were collected, and the block they were collected from. Send your samples as soon as possible to a testing lab in your area with experience in vineyard tissue testing.
Table 2. When, where, and how to sample whole grape leaves for tissue nutrient analysis.| When to sample | Where to sample |
|---|---|
| Bloom (30-60%) | Collect a leaf that is opposite the basal cluster on a fruiting shoot. The key is to collect a fully mature but non-senescing leaf. |
| Véraison (40-60%) | Collect a leaf that is the youngest, most fully developed / mature leaf on the shoot. This is approximately the third or fourth leaf up the shoot from the secondary cluster. The idea is to collect a leaf that would be of similar age at the time of collection to that of a leaf that would have been collected at bloom. |
Adjusting Soil pH
The ideal soil pH for wine grapes is considered to be 6.5 to 8.0, and for juice (Concord) grapes it is lower, 5.0 to 6.0. Grapes are fairly resilient and can tolerate some deviation from these pH levels (i.e., up to pH of 8.2 for wine grapes in some areas of the state). However, since soil pH directly influences nutrient availability, it may be necessary to adjust the soil pH to improve the site for grape production.
Adjusting soil pH is a slow process. It can take months to years to establish a consistent change in soil pH after amendments are made. If you are amending your soil to adjust pH, do not expect to see a measurable change in pH for at least 3 months after your application. It is better to be patient and not sample your soil again for pH testing until a year after the amendment.
Raising soil pH (common in western Washington). The most common material used to increase soil pH is agricultural lime, or limestone (Table 3). There are several factors to consider when using any liming material to raise soil pH. The first is deciding how much of a change you want to make. In other words, how much higher do you want the soil pH to be? The higher the increase, the greater amount of lime is required (Table 4).
Table 3. Common liming materials to increase soil pH. Table modified from Brady and Weil (2010).| Name | Formula | Equivalent % CaCO3* | Comments on manufacture and use |
|---|---|---|---|
| Limestone / calcitic limestone | CaCO3 | 100 | Natural rock ground to a fine powder. Low solubility. |
| Dolomitic limestone | CaCO3–MgCO3 | 95–108 | Natural rock ground to a fine powder; somewhat slower reacting than calcitic limestone. |
| Hydrated lime | Ca(OH)2 | 134 | Caustic, fast-acting, can burn foliage, expensive. |
| Burned lime | CaO | 178 | Caustic, fast-acting, can burn foliage, expensive. |
| Basic slag | CaSiO3 | 70 | Byproduct of the pig iron industry. Must be finely ground. |
| Sugar beet lime | CaCO3 | 80–90** | Byproduct of sugar beet processing. |
| Marl | CaCO3 | 40–70 | Mined from shallow coastal beds, dried, and ground. |
*Note that CaCO3 equivalent is the efficacy of the material relative to standard lime, not the purity of the material. For more information on how this is derived, refer to Brady and Weil (2010).
**Purity rating from California Fertilizer Foundation (1995).
The second factor is the soil’s buffering capacity. A high buffering capacity indicates a strong resistance to a change in pH. The buffering capacity is related to the cation exchange capacity. Increasing soil pH involves replacing hydrogen (H+), with calcium (Ca2+) or, in some cases, calcium plus magnesium (Mg2+). A soil that has a low buffering capacity (sand) will require less material to change pH than a soil with a high buffering capacity (clay loam). A soil test report should provide you with information on buffering capacity in low pH soils.
The third, equally important factor is the reactivity of the material that is used. Limestone comes in many grades that reflect how finely ground it is. A more finely ground lime will react more quickly than a coarsely ground material. Some products, such as hydrated or burned lime, react more quickly than limestone but are more difficult to handle and may be more expensive (Table 3).
Lowering soil pH (common in eastern Washington). Lowering soil pH is less common than raising soil pH and has several challenges. Before attempting to lower pH it is best to test the soil for the presence or absence of free calcium carbonate (free lime), which can make lowering soil pH very difficult. This can be checked by dripping muratic acid into a soil sample using an eye dropper. Muratic acid is available at stores with masonry supplies, as well as pool and spa stores. If there is free calcium carbonate (lime) in the soil, the sample will bubble in the presence of muratic acid, with more bubbles indicating higher calcium carbonate. Information on testing for free calcium carbonate and interpreting the results can be found in Horneck et al. (2007). Free calcium carbonate can increase with soil depth, and if it is present in the top 18 inches of soil, it could be difficult to impossible to lower the soil pH, and can take several years. If there is free lime in your soil, collect a soil sample from the zone(s) with free lime and have it analyzed for the actual free lime content by a soil test lab.
The best material to lower soil pH is pelletized elemental sulfur (Table 5). However, the process of lowering soil pH with sulfur relies on the activity of soil microorganisms, and changes are slow. The amount of sulfur required to shift soil pH is shown in Table 6.
Table 4. Lime requirements (CaCO3 tons per acre) to raise soil pH. Table modified from Vossen (no date). For exact calculations for raising soil pH, please refer to Brady and Weil (2010), page 294.| Soil Texture | pH 4.5 raised to 5.5 | pH 5.5 raised to 6.5 |
|---|---|---|
| Sand and loamy sand | 0.5 | 0.6 |
| Sandy loam | 0.8 | 1.3 |
| Loam | 1.2 | 1.7 |
| Silt loam | 1.5 | 2.0 |
| Clay loam | 1.9 | 2.3 |
| Material (100% purity) | Chemical Formula | Material Equivalent (Tons) to 1 Ton Sulfur |
|---|---|---|
| Gypsum | CaSO4 + 2H2O | 5.38 |
| Elemental sulfur | S | 1.00 |
| Sulfuric acid | H2SO4 | 3.20 |
| Ferric sulfate | Fe2(SO4)3 + 9H2O | 5.85 |
| Lime sulfur (22% S) | CaS | 3.65 |
| Aluminum sulfate | Al2(SO4)3 | 6.34 |
| Soil Texture | pH 7.5 lowered to 6.5 | pH 8.0 lowered to 6.5 | pH 8.5 lowered to 6.5 |
|---|---|---|---|
| Sandy | 0.2–0.3 | 0.5–0.7 | 0.7–1.0 |
| Clay | 0.4–0.5 | 0.7–1.1 | 1.0–1.3 |
Saline and Sodic Soils
Salt-affected soils can occur naturally but the processes can also occur through different management practices in the vineyard. For a thorough overview of salt-affected soils, please refer to Horneck et al. (2007).
Soils are classified into one of four categories relative to salt which are normal (not affected), saline (high concentrations of salts), sodic (high concentration of sodium) and saline sodic (salts and sodium are both in high concentrations). All of these are chemical properties and soils are measured for pH, electrical conductivity (EC), and either their sodium absorption ratio (SAR) or their exchangeable sodium percent (ESP). SAR is the ratio of sodium to calcium plus magnesium in soil, while ESP is the percent of sodium relative to all basic cations to determine the soil’s salt classification (Table 7).
Saline soils adversely affect vine growth by limiting the availability of many plant nutrients and by creating an environment that can burn root hairs. Sodic soils are problematic in two ways: (1) excess sodium can limit uptake of calcium, magnesium, and/or potassium; and (2) excess sodium causes the soil surface to seal and water is slow to penetrate, leading to water runoff which prevents vines from getting the water they require.
Table 7. Threshold values of key soil components used for determining normal, saline, sodic, or saline-sodic soils. Values are for soils with a pH of less than 8.5.| Soil Definition | Sodium Absorption Ration (SAR) | Exchangeable Sodium Percent (ESP) | Electrical Conductivity (EC, dS/m) |
|---|---|---|---|
| Normal | Less than 13 | Less than 15 | Less than 4 |
| Saline | Less than 13 | Less than 15 | Greater than 4 |
| Sodic | Greater than 13 | Greater than 15 | Less than 4 |
| Saline-Sodic | Greater than 13 | Greater than 15 | Greater than 4 |
Soils that are naturally saline or sodic are not good choices for vineyard sites and should be avoided. However, soils can become salt-affected over time due to management, and in regulated deficit irrigated vineyards in eastern Washington, several factors can lead to developing salt-affected soils.
The most common factor in developing salt-affected soils in Washington vineyards is the use of water from deep wells (groundwater) which frequently has high levels of sodium or calcium carbonates and bicarbonates. Typically, water from irrigation canals (surface water) is not high in salt or sodium.
The use of regulated deficit irrigation (i.e., reduced water) and poor quality groundwater work together to increase the development of salt-affected vineyard soils. In addition, unlike other growing regions, low rainfall in eastern Washington prevents leaching of the excess salt or sodium that builds up in the system.
Soil nutrient amendment sources can also play a role in how a soil is salt-affected. All fertilizers have salt indexes and it is best to know if a fertilizer is “salty” or not. There is actually a greater risk of salt build-up with organic fertilizers and soil amendments since many composts and manures are naturally salty. Request a test and know the salt index of any compost or manure before you add it to your vineyard. Conduct a soil test annually if you are using a material with an electrical conductivity (EC) of 4 dS/m and above.
Remediation of salt-affect soils is difficult. If groundwater is of poor quality, one option is to treat the water before using it, which typically can be done with the injection of sulfuric acid. However, this practice is not an option for organic vineyards. Typical remediation techniques for saline soils is leaching, which is in contrast to most irrigation management recommendations.
The addition of gypsum is used to remediate sodic soils, while a combination of the adding of gypsum, sulfur, and leaching is needed for saline-sodic soils. Specific recommended rates and practices have not been established for Washington vineyards.
Water Quality and Testing
Irrigation water chemistry varies, and the chemistry of the water will affect the chemistry of the vineyard soil to which it is applied. While the chemistry of water sources varies slightly over a growing season, knowing the general characteristics of the irrigation water being used on a vineyard is important.
A vineyard’s water source should be tested when the land is first purchased. For vineyards that are irrigated using surface water sources (i.e., irrigation district water), the water quality is typically good, although it can vary depending on where in the distribution chain your access is. Water from groundwater sources (i.e., wells or deep wells) are typically of lower quality and often can adversely affect the soil. All water sources should be retested every five years. Choosing the test lab to work with should follow the same guidelines as used for choosing a test lab for plant or soil testing.
Things to test for in particular are: water pH, electrical conductivity (EC), hardness of the water, and for the cations calcium, magnesium, and sodium (see SAR and ESP above). For EC, the salinity hazard is considered low when <250, medium from 250-750, high from 750-2250 and high above 2250 dS/m and sodium is considered low with SAR <10, medium 10-18, high 18-26, and very high if SAR exceeds 26 (USSLS 1954).
Low sodium and salinity water can be used with no restrictions, and in grape vineyards, repeated use of water in the medium classification should be limited, and high and very high are not considered suitable. An excellent reference guide regarding water management in saline and sodic situations is Diagnosis and Improvement of Saline and Alkali Soils (Richards 1954).
Types of Fertilizers
Organic versus Synthetic
Nutrients added as fertilizers can be either “synthetic” or “organic.” Synthetic fertilizers are either manufactured or are refined from natural sources to increase their concentration and plant availability. Organic fertilizers are materials that have been subject to little or no processing and are derived from either biological (plant or animal) or mineral sources. Following application to the soil, organic fertilizers release their nutrients in water-soluble (plant available) forms via natural processes, such as chemical weathering of minerals and the biological breakdown of organic matter.
Organic fertilizers are lower in nutrient concentration than their synthetic counterparts. They also release nutrients at a slower rate than conventional fertilizers. Therefore, greater amounts of organic fertilizers are often required to achieve the same goal as a synthetic fertilizer application, but their effects may be longer lasting. Applying organic fertilizers on a regular basis can build up nutrients in the soil and ultimately result in a reduced need for high-rate applications in the future. Unfortunately, choosing an organic fertilizer can involve a trade-off in either cost or convenience. While many biological fertilizers such as manure, compost, mulch, or cover crops are relatively inexpensive, they can be inconvenient to apply. Conversely, commercial organic fertilizer blends are convenient but can be expensive. The fact that commercial organic fertilizers often include one main nutrient and a number of others present in smaller proportions can also pose problems, as these ratios will not necessarily correspond to those required by a vineyard.
Plant Availability
The fact that the majority of synthetic fertilizers provide immediate plant access to nutrients means that they can be used very early in the growing season before temperatures rise. However, the solubility of these fertilizers also means that they are prone to leaching-loss following heavy rain or irrigation. In contrast, most organic fertilizers are much slower to release their nutrients over the growing season (and even in later years). Their release depends on the activity of soil microorganisms, which are influenced by temperature and moisture.
Nutrient Composition
Commercial synthetic and organic fertilizer labels display three numbers that indicate the total percentage of the three primary macronutrients: nitrogen (N), phosphorus in the form of phosphate (P2O5), and potassium in the form of potash (K2O). These numbers specify the total amount of these nutrients in a given fertilizer (Table 8) rather than the amount available to plants. While these values are indicative of immediate availability of nutrients in synthetic fertilizers, this is not the case for most organic fertilizers (Cogger 2005). Since organic fertilizers tend to release their nutrients slowly, only a percentage of the total amount of nutrients listed on the label will be available the year they are applied. For example, only 0-50% of the nitrogen content in a bio-based organic fertilizer (e.g., compost, manure) will be available in the first year of application (Sullivan 2015).
Determining Composition of Organic Fertilizers
Many resources provide the compositional breakdown of nutrients available in different types of organic fertilizers.
Collins, D. et al. 2013. Soil Fertility in Organic Systems: A Guide for Gardeners and Small Acreage Farmers.
Pacific Northwest Extension Publication PNW646.
Cogger, C. 2005. Home Gardener’s Guide to Soils and Fertilizers (Home Garden Series). Washington State University Extension Publication EM063E.
For growers using biological fertilizers in their nutrient management regime, Oregon State University has developed the Organic Fertilizer and Cover Crop calculator for estimating the nutrient contribution of organic fertilizers, compost, and cover crops over a typical season.
| Product | Nitrogen (%) | Phosphate (P2O5; %) | Potash (K2O; %) |
|---|---|---|---|
| Ammonium sulfate | 21 | 0 | 0 |
| Ammoniated super-phosphate | 3-6 | 48-53 | 0 |
| Di-ammonium phosphate | 18 | 36 | 0 |
| Mono-ammonium phosphate | 11 | 52 | 0 |
| Super-phosphate | 0 | 18 | 0 |
| Triple super phosphate | 0 | 46 | 0 |
| Potassium chloride | 0 | 0 | 60 |
| Potassium sulfate | 0 | 0 | 50 |
| Potassium-magnesium sulfate | 0 | 0 | 22 |
Application Strategies: Foliar vs. Ground
Once a potential deficiency has been diagnosed, fertilizers can be used to correct it (Table 9). Due to the relatively elevated requirement of macronutrients in vine nutrition, these elements are typically applied to the soil and rates can differ for juice and wine grapes. Per acre fertilizer rates indicate applying the total rate over that acre, banding it in the vine row/hill. In these situations, rates do not refer to the actual applied area, which is the case with banded herbicide applications.
Conversely, most micronutrients should be applied as a foliar spray. These nutrients generally have a low availability in the high pH soils typical of central Washington vineyards and are fairly immobile in the soil and/or plant. Furthermore, foliar applications of individual elements have been found to be more successful than tank mixes or mixes developed by fertilizer manufacturers (Table 10) (Davenport et al. 2011). While some nutrient deficiencies/excesses are quite difficult to amend with a single adjustment and may require several years of corrective applications to yield results, others will respond immediately.
Table 9. Interpreting ranges of concentrations of soil nutrients. Modified from Dow et al. 1983.| Nutrient* | Low below (ppm) | Moderate (ppm) | Excessive above (ppm) |
|---|---|---|---|
| N** | 10 | 10-40 | 50 |
| P | 4 | 6-8 | 10 |
| K | 80 | 100-220 | 240 |
| Mg | 100 | 120-240 | 100-250 |
| Ca | 500 | 600-1800 | 2000 |
| S | 4 | 5-20 | 25 |
| B | 0.5 | 0.6-1.0 | 1.1 |
| Zn | 0.5 | 1-2 | 2.5 |
| Fe | 15 | 15-25 | 50 |
| Cu | 0.4 | 0.50-0.75 | 1 |
| Mn | 10 | 15-20 | 25 |
*Other than N, modifications of nutrients prior to planting the vineyard are largely based on soil test and highly recommended. Soil testing in an established vineyard should only be used in concert with tissue test results.
**N is typically provided as lb/acre as a combination of soil test NO3-N and NH4-N. Assume that this will be available early in the growing season (until bloom) and adjust N fertilizer management accordingly by subtracting the lb/acre available from the planned N use.
| Nutrient | Juice and wine grapes (bloom) | Véraison juice grapes | Véraison wine grapes | Véraison |
|---|---|---|---|---|
| N (%) | 2.50-3.50 | 2.10-3.00 | 2.25-3.25 | - |
| P (%) | 0.15-0.45 | 0.15-0.45 | 0.15-0.30 | - |
| K (%) | 0.75-1.50 | - | - | 0.50-1.00 |
| Mg (%) | 0.25-0.50 | - | - | 0.25-0.50 |
| Ca (%) | 1.00-3.00 | - | - | 1.00-3.00 |
| B (ppm) | 30-100 | - | - | 30-100 |
| Zn (ppm) | 25-100 | - | - | 15-50 |
| Fe (ppm) | >75* | - | - | >75 |
| Cu (ppm)** | 6-20 | - | - | 6-20 |
| Mn (ppm)** | 30-100 | - | - | 30-100 |
| Na (%)*** | 0.20-0.50 | - | - | 0.20-0.50 |
Note: As of yet, critical ranges for S concentrations in grapevine tissues have not been determined.
*Fe concentrations can exceed 75 ppm without causing any problems in plants, and no upper limit has been identified for Fe for grapevines grown in the Pacific Northwest.
**Cu, Mo, Ni, and Mn are rarely found to be deficient or excessive in Washington vineyards.
***Sodium is included due to potential toxicity in irrigated regions.
Nutrient Recommendations Pre- and Post-Planting
In the following sections, there are figures that show where the vine stores specific nutrients over the course of its annual development. The vertical axis shows the pounds per acre of nutrient the plant is taking up, divided among each of the major storage organs (roots, wood, leaves, and fruit). The horizontal access denotes the key development stages (dormant, bud burst, bloom, véraison, and harvest) of the vine. These graphs are designed to help the reader see when and where key nutrients are being used. This should facilitate the timing of fertilizer application so that the nutrient is available at the time of, or just before, peak vine use.
Macronutrients
Nitrogen
Plants use nitrogen (N) to generate many compounds that are necessary for growth and development, including nucleic acids (the building blocks of DNA), amino acids (the building blocks of proteins), and pigments (including green chlorophyll in leaves and purple anthocyanins in fruit).
Although wine grapevines have a lower demand for N than most crop plants, it is still a nutrient that requires supplementation and management that can be challenging. Ensuring that there are appropriate levels of N is often the driving force behind fertility expenditures, especially in older vineyards.
Excessive N can cause problems in vineyards and is easier to identify than a deficiency. In fact, N deficiency symptoms are often not as easily recognizable as other nutrient deficiencies. Symptoms of N deficiency and when and where they are likely to occur, are in Table 11. The presence of deficiency symptoms is not proof of an N deficit, as other factors such as drought and/or inappropriate water management, insect pests, and over-cropping can cause similar symptoms. In order to prevent yield and/or quality loss due to an N deficiency or excess N, growers should use a combination of vine observations with bloom or véraison whole leaf tissue tests as a guide for devising a fertilizer program.
Remediation
Pre-plant. Soil tests for N have not been linked to long-term vineyard performance and are therefore not recommended for this nutrient. Since the main available form of N (nitrate, NO3) moves very easily in soil solution, concentrations vary greatly with each irrigation or rain event. Furthermore, the rate of decomposition and eventual availability of organic N in the soil cannot be easily predicted. Instead, prior to planting a new vineyard, N should be added to the soil in varying amounts depending upon previous crops and whether you will be growing juice or wine grapes (Table 12).
Established vineyards. When vines take up N, and where it is stored in the vine, is pictured in Figure 6. In established vineyards, N is lost through the harvest of fruit and annual pruning. Without any fertilizer input most soils would eventually become depleted of this nutrient. The amount of N removed from a vineyard through the fruit is the minimum amount that should be applied via the application of fertilizers to the soil or growth of N-fixing cover crops each year. This ranges between 10 and 60 lb of N per acre, depending on the variety and crop load. However, a vineyard’s N requirement ultimately depends upon the soil type, its fertilization history, irrigation practices, and variety. The presence of soil organic matter, such as legume cover crops, vine litter, composts, and manures, should be considered for their potential N contributions each season.
Application. While the nitrate form of N moves easily in soil solution and is available to plants immediately, it is also prone to loss through leaching. Conversely, the ammonium form of N is not immediately available to plants, but will convert to nitrate in the soil relatively quickly. In the case of very sandy soils, or if the fertilizer is applied as a solid material, the ammonium form of N should be used and incorporated into the soil to minimize volatilization. If there is free calcium carbonate within the top 6 inches of soil, urea should not be used as a granular fertilizer because it will react with the calcium carbonate, ultimately increasing the loss of N through ammonia volatilization. Within the scope of these recommendations, the choice of exact fertilizer formulations can generally be based on cost and whether the product is acidifying (if your soil pH is less than 6.0). For organic growers, a combination of leguminous cover crops planted in the fall and incorporated into the soil pre-bloom can be combined with a soluble N source (e.g., blood meal) applied at véraison (if necessary).
Table 11. Symptoms of nitrogen (N) deficiency and excess.| - | Deficient | Excess |
|---|---|---|
| Symptom | Pale green leaves and, with extreme deficit, small leaf size. Vine growth may be slow, with short internodes and uniformly small leaves. Reduction in the number of clusters and berries, as well as berry set. Poor pigmentation in red-fruited varieties (see Pacific Northwest Extension Publication PNW644). Low yeast-assimilable nitrogen (YAN) in fruit. | Excess canopy resulting in shading of internal leaves. Fruit yields tend to be low due to a paucity of clusters and/or poor fruit set, and mature leaves are unusually large and deep green. Long internodes. Shoot diameters greater than 0.5 inches. Continuous shoot growth through véraison. |
| Where (Plant) | First appears on oldest leaves. Mild deficiencies generally appear first on basal or mid-shoot leaves as a fading of the green leaf color, while severe deficiencies exhibit a more pronounced yellowing (chlorosis) of the leaves. | - |
| Where (Vineyard) | Vineyards with soil that is low in organic matter tend to be prone to N deficiencies. In addition, N additions are almost always required on sandy or shallow soils. | Well-sourced water (groundwater) may be high in nitrates. Soils with high organic matter content. |
| When | Deficiency symptoms can occur at any time, but are more common during periods of rapid shoot growth in the spring (when N is being mobilized) and during periods of water stress, when N cannot be taken up by the plant. | - |
| Previous crop | Juice grapes | Wine grapes |
|---|---|---|
| New land | 140 | 60 |
| Corn or small grain (wheat), residue removed | 100 | 50 |
| Corn or small grain, straw plowed under | 120 | 60 |
| Potatoes or sugar beets | 100 | 50 |
| Beans or peas | 80 | 40 |
| Alfalfa with no top growth | 80 | 40 |
| Alfalfa, top growth plowed under | 60 | 30 |
| Vetch or other legume plowed under | 60 | 30 |
Nitrogen is required at the highest levels during rapid canopy growth, which is commonly between bud break and fruit set. However, only minimal amounts of root growth and nutrient uptake occur during the bud break period, thus N demand at this time is primarily met through the use of reserves stored in roots and other woody perennial structures. Since N absorption by roots is most rapid around bloom, a good time for soil applications in drip-irrigated vineyards is just before bloom when clusters have emerged but have not started elongating. A second application should be carried out at the end of bloom, with a third at véraison. The total annual dose of N should be split equally across the three applications. Lower rates of fertilizer can also be applied via drip irrigation, but should be applied in smaller increments over time to prevent leaching, and the first and last applications should coincide with bloom and véraison. For other irrigation systems (sprinkler or furrow), split applications are recommended with the first application at the 3-4 leaf stage to supply N for early growth, and the second application at the end of bloom for fruit filling and bud development. If only a single application can be made, the 3-4 leaf stage should be used. Recommended rates are in Table 13.
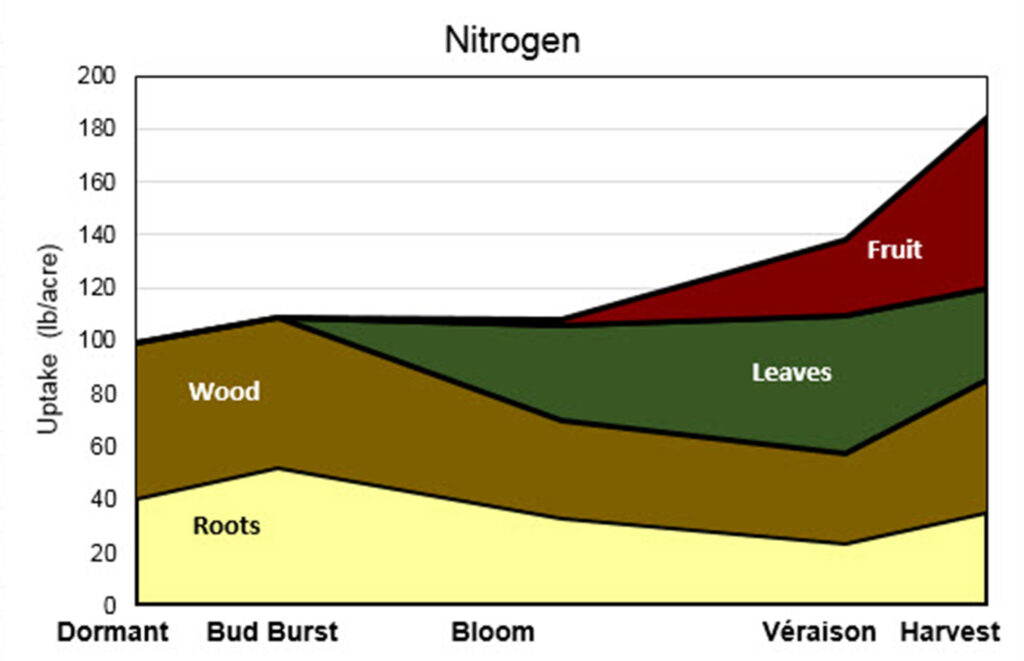
The image is a stacked area chart labeled “Nitrogen” that illustrates how nitrogen uptake is distributed among different parts of a grapevine over the growing season. The vertical axis on the left shows nitrogen uptake in pounds per acre, ranging from 0 to 200 lb/acre. The horizontal axis shows vine growth stages in order: Dormant, Bud Burst, Bloom, Véraison, and Harvest.
Nitrogen uptake is divided into four colored and labeled components stacked on top of one another: roots (light yellow, bottom layer), wood (brown, above roots), leaves (dark green), and fruit (red, top layer). The total height of the stacked areas represents total nitrogen uptake at each growth stage.
During the dormant stage, most nitrogen uptake is allocated to roots and wood, with roots around 40 lb/acre and wood around 60 lb/acre, and little to no uptake by leaves or fruit. At bud burst, total uptake increases slightly, with roots peaking near 50 lb/acre and wood remaining the dominant component.
By bloom, nitrogen allocation shifts: uptake by roots and wood decreases, while leaves begin to account for a substantial portion of nitrogen uptake. At véraison, leaf uptake becomes prominent, while fruit uptake begins and increases sharply, shown by a growing red section at the top of the chart.
By harvest, total nitrogen uptake reaches its highest level, approaching about 180 lb/acre. Fruit accounts for a large share of this increase, leaves remain significant, and roots and wood increase slightly compared to véraison. Overall, the chart demonstrates a seasonal shift in nitrogen demand from perennial structures (roots and wood) early in the season to leaves and fruit later in the season, especially during fruit development and maturation.
| - | Annual N requirement (lb N/acre)* |
|---|---|
| Drip irrigated (juice grapes) | 40-60 |
| Sprinkler or furrow irrigated (juice grapes) | 60-80 |
| Sandy to loamy sand soil (white wine grapes) | 40-60 |
| Loamy to loamy silt soil (white wine grapes) | 20-40 |
| Sandy to loamy sand soil (red wine grapes) | 20-40 |
| Loamy to loamy silt soil (red wine grapes) | 10-30 |
*Soil test N is typically provided as lb/acre as a combination of soil test NO3-N and NH4-N. Adjust N fertilizer by subtracting the lb/acre available from the planned N use.
Phosphorus
Phosphorus (P) is vital to plant growth, and is an essential component of many biological compounds within a plant, including nucleic acids, sugar phosphates, enzymes, and energy-rich phosphate compounds. It plays a crucial role in virtually every plant process that involves the transfer of energy, as well as photosynthesis.
Phosphorus deficiency, especially late in the season, can often be confused with symptoms associated with Grapevine Leafroll Disease or Red Blotch Disease. Other symptoms are described in Table 14.
Table 14. Symptoms of phosphorus (P) deficiency and excess.| - | Deficient |
|---|---|
| Symptom | Early season: Uncharacteristically dark green leaves. Mid-late season: Reddish-purple leaves in red grape varieties; light pink leaves in white grape varieties. |
| Where (Plant) | Symptoms typically restricted to the basal leaves. |
| Where (Vineyard) | Cool, wet soils in spring may decrease availability of this nutrient resulting in vines exhibiting symptoms. Soil pH below 6.5 and above 7.5 reduce P availability. |
| When | Symptoms typically manifest before the onset of véraison. |
Remediation
Pre-plant. Pre-plant soil tests for P availability are beneficial, and application is recommended when results indicate low concentrations of this nutrient (10 ppm or less). Rates vary based on the extent of the deficiency (Table 15).
Established vineyards. When vines take up P and where it is stored is pictured in Figure 7. Since P deficiency symptoms can be mistaken for Grapevine Leafroll Disease or Red Blotch Disease, both tissue testing and virus testing is recommended if P deficiency is suspected. Soil tests can also be helpful when estimating fertilization requirements. If P is found to be deficient in established vineyards, 15 to 20 lb P per acre (35 to 46 lb P2O5) can be applied in wine grapes, and 30 to 40 lb P per acre (68 to 92 lb P2O5) can be applied in juice grapes.
Since P demand increases throughout the growing season, applications should be made as a split dose at the 4 to 6 leaf stage, followed by an application at bloom and another a month later. Fertilizer can be applied either to the soil or the foliage to rectify a low P status of the vines. Foliar or liquid soil applications are the most effective means of delivering additional P, as this nutrient is relatively immobile in the soil.
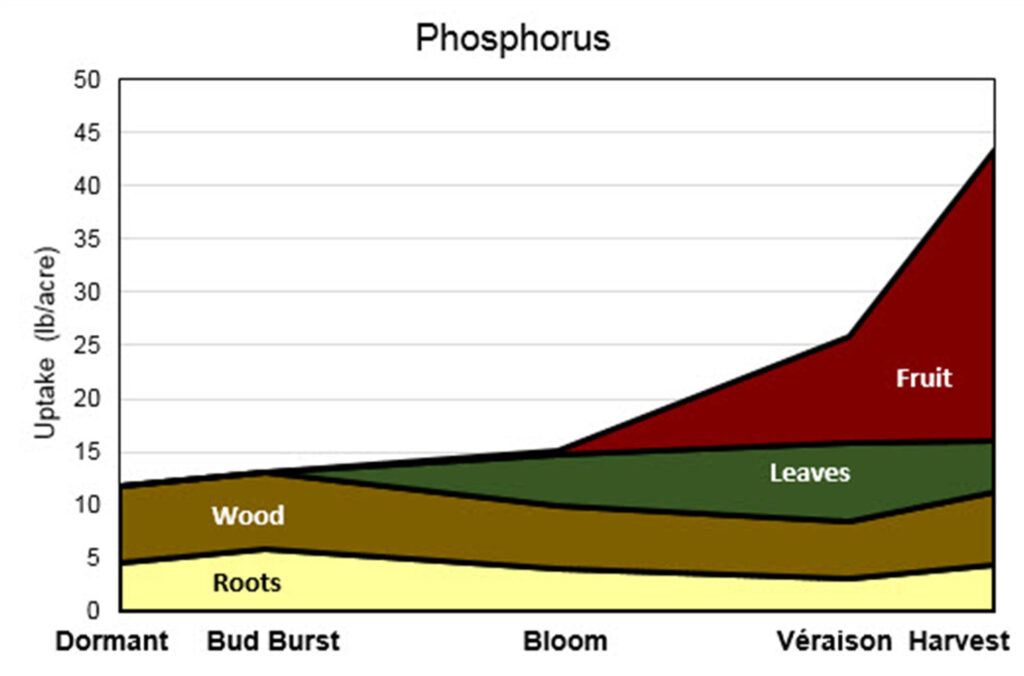
The image is a stacked area chart titled “Phosphorus” that shows phosphorus uptake in grapevines over the growing season. The horizontal axis lists growth stages: Dormant, Bud Burst, Bloom, Véraison, and Harvest. The vertical axis shows uptake in pounds per acre, ranging from 0 to 50.
Phosphorus uptake is divided into four labeled components: Roots (light yellow), Wood (brown), Leaves (green), and Fruit (red). During the dormant and bud burst stages, phosphorus uptake is low and primarily allocated to roots and wood. By bloom, total phosphorus uptake increases slightly, with a modest contribution from leaves and reduced allocation to wood and roots. At véraison, fruit uptake begins and increases rapidly. By harvest, fruit accounts for the largest share of phosphorus uptake, while leaves, wood, and roots contribute smaller, relatively stable amounts. Overall, the chart shows that phosphorus demand is comparatively low early in the season and increases sharply late in the season, driven mainly by fruit development.
| Soil test values (ppm) | Rate of application of P2O5 (lb/acre)* |
|---|---|
| 2 | 295 |
| 4 | 204 |
| 6 | 159 |
| 8 | 114 |
| 10 | 68 |
| Above 10 | 0 |
*To convert P, often listed on a soil test, to P2O5, the form available in fertilizers, multiply by 2.29.
Potassium
Potassium (K) plays an important role in a number of biochemical processes in plants, including the synthesis of proteins and the metabolism of carbohydrates. This nutrient is also vital for the transport of solutes as well as the opening and closing of stomata, which is an important mechanism for maintaining a vine’s water status. While little is known about the exact function of K in grape berries, it has been found to be essential for their growth and is involved in controlling acidity and pH of their juice.
A list of K deficiency symptoms is presented in Table 16.
Table 16. Symptoms on potassium (K) deficient vines.| - | Deficient |
|---|---|
| Symptoms | Mild: fading/yellowing of the leaf that begins at the leaf margin and advances towards its center. Mild: Leaf tissue immediately adjacent to the main veins maintains its dark green color. Severe: Chlorotic areas become necrotic and appear scorched. Leaf margins will curl, and vines will have reduced vigor, fruit set, and total yield. Reduced soluble solids (Brix) and color in fruit. |
| Where (Plant) | Foliar deficiency symptoms often become noticeable first on mid-shoot leaves. |
| Where (Vineyard) | Deficiencies are common in soils that are high in exchangeable calcium and magnesium. Vineyards with sandy soils or little topsoil. Root issues, such as compact soil, nematodes, phylloxera, and poor water drainage can also lead to reduced K uptake. |
| When | Mid-late summer. |
Remediation
Pre-plant. Soil tests should be carried out prior to planting in new vineyards to assess for low K soils, in which case K fertilizer can be applied (Table 17).
Table 17. Application rates of potassium in pre-plant situations based on soil test results.| Soil test values (ppm) | Rate of application of K2O (lb/acre)* |
|---|---|
| 60 | 480 |
| 120 | 360 |
| 180 | 240 |
| 240 | 120 |
| >240 | 0 |
*To convert elemental K values to K2O multiply by 1.20. However, the amount of K listed on a fertilizer is typically in the form of K2O.
Established vineyards. Figure 8 illustrates when K is taken up and where it is stored in vines. The addition of K is rarely needed in juice grape vineyards due to its historical overuse in an erroneous attempt to treat blackleaf (Olmstead et al. 2005). If symptoms are noted, tissue tests should be taken to rule out other potential causes, such as extreme drought or moisture, and pesticide phytotoxicity. Excess K can result in fruit with high juice pH, which can negatively affect juice and wine quality.
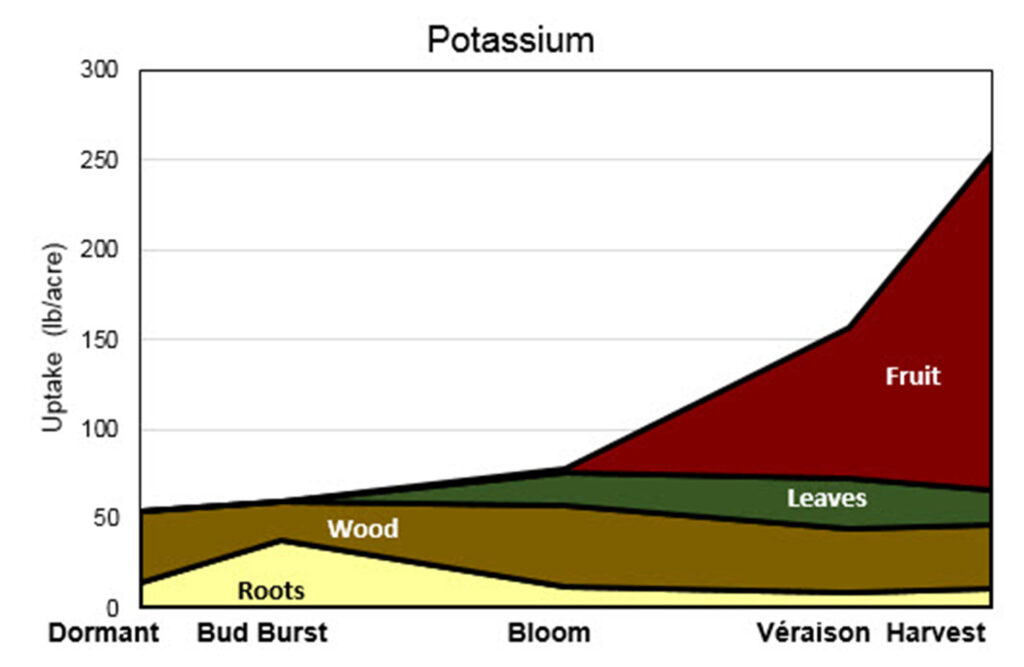
This is a stacked area graph titled “Potassium.” The y-axis is labeled “Uptake (lb/acre)” and ranges from 0 to 300 pounds per acre. The x-axis shows five growth stages: Dormant, Bud Burst, Bloom, Véraison, and Harvest.
Four plant components contribute to total potassium uptake: Roots (light yellow), Wood (brown), Leaves (green), and Fruit (red). The stacked areas show how each component contributes to total uptake over time.
Dormant: Total uptake is just above 50 lb/acre. Most potassium is in wood, with smaller amounts in roots. There is no contribution from leaves or fruit at this stage.
Bud Burst: Total uptake increases slightly (around 60 lb/acre). Roots increase noticeably compared to dormant, while wood remains a major contributor. Leaves and fruit are still minimal or absent.
Bloom: Total uptake rises to roughly 75–80 lb/acre. Leaves begin contributing meaningfully. Roots decline from their earlier peak. Wood remains relatively steady. Fruit begins to appear but is still small.
Véraison: Total uptake increases substantially to around 150–160 lb/acre. The major change is a sharp rise in fruit potassium uptake, which becomes the dominant component. Leaves remain moderate. Wood and roots gradually decline in relative contribution.
Harvest: Total uptake peaks at approximately 250 lb/acre. Fruit accounts for the majority of potassium uptake at this stage, showing the steepest increase. Leaves contribute a moderate amount, while wood and roots represent smaller portions compared to earlier stages.
Overall trend:
Total potassium uptake increases gradually from Dormant through Bloom, then rises sharply between Véraison and Harvest. Early in the season, potassium is primarily stored in roots and wood. As the season progresses, leaves contribute during active growth, and finally fruit becomes the dominant sink for potassium approaching harvest.
If a K deficiency is diagnosed, short-term correction can be made using a foliar spray, but that rarely fully corrects the problem. The long-term solution is a soil application of K. Rates vary with the severity of the deficiency, but a soil application of 100 to 150 lb K per acre (120 to 180 lb K2O) is typical. In the case of furrow-irrigated vineyards, deep placement (“shanking in”) of the fertilizer close to the vine is required. Liquid K sources for application through the drip system are available, but the application should be made across 2 to 4 irrigations to prevent root burning.
The most rapid uptake of K is observed throughout berry development and ripening, during which time grape clusters act as a major sink for this nutrient. Therefore, to avoid a negative impact on fruit quality, applications should not be made after the onset of véraison. Instead, it is recommended that soil applications be made between the 3 to 4 leaf stage and bloom.
There are several forms of K fertilizer, and the main advantage of one type over another is the cost. However, the least expensive form (KCl) can cause injury to vines and should be leached with irrigation water after use. It should only be used in well-drained soils with a low salt content.
Magnesium
Magnesium (Mg) is a primary component of chlorophyll, which is the green pigment required for photosynthesis in plants. It also plays several important roles in plant development, including the activation of enzymes involved in carbohydrate metabolism, as well as structural and regulatory roles during protein biosynthesis.
Symptoms of Mg deficiency (Table 18) can easily be confused with other nutrient deficiencies, particularly iron (Fe) deficiency. However, the chlorosis observed in Mg deficiencies tends to be in the older leaves first, moving to the younger leaves, whereas chlorosis in response to low Fe tends to be in the younger leaves.
Remediation
Pre-plant. In pre-plant situations, soil tests for extractable Mg indicating low Mg levels (less than 60 ppm) should be amended by applying 10 to 100 lb Mg per acre. If soil levels are present at the lower end of normal (60 to 100 ppm), up to 60 lb Mg can be applied to the soil per acre if desired (Horneck et al. 2011).
Table 18. Symptoms on magnesium (Mg) deficient vines.| - | Deficient |
|---|---|
| Symptoms | Mild: interveinal leaf chlorosis (yellowing) that begins near the leaf margin and progresses inwards. Tissue immediately around veins remain green. Severe: chlorotic areas turn necrotic. In red-fruited varieties, deficiencies can cause leaves to turn a reddish color rather than the typical yellow/creamy-white. |
| Where (Plant) | First appears on oldest leaves. Basal and mid-shoot leaves. Young vines (due to limited depth of the root system). |
| Where (Vineyard) | Occur in acidic soils (pH less than 5.5). Exacerbated in acidic soils with high K. Old, leached hardpan soils. Sandy soils. |
| When | Mid-late summer. |
Established vineyards. When vines take up Mg and where it is stored is pictured in Figure 9. In established vineyards, soil tests do not adequately predict Mg availability to plants; leaf tissue tests are preferred. If tissue tests indicate concentration is below the normal range, either foliar or soil applications can be used. While foliar applications are useful for the short-term correction of mild deficiencies, soil applications provide a longer lasting remedy.
For foliar sprays, foliage can be sprayed with 5 to 10 lb magnesium sulfate (MgSO4, Epsom salts) in 100 gallons of water per acre. This can be mixed with the majority of fungicide or insecticide sprays unless their labels specifically caution against it. Two to three total applications made at approximately 2-week intervals should supply enough Mg to correct the deficiency.
To correct long-term Mg deficiencies, apply dolomitic lime (calcium-magnesium carbonate), fertilizer-grade MgSO4, or other fertilizer containing magnesium oxide (MgO) to the soil. If the soil is acidic (pH less than 5.5), dolomitic limestone should be applied at 1 to 2 tons per acre. If the soil pH is neutral, MgSO4 can be applied at 80 to 120 lb per acre. Rates can be adjusted according to the severity of the deficiency (Christenson and Peacock 2000). Soil applications should be made in the early spring; however, it can be applied any time during the season that symptoms appear. Deep placement is recommended with furrow irrigation, and rates can be reduced by a third to a half with drip irrigation.
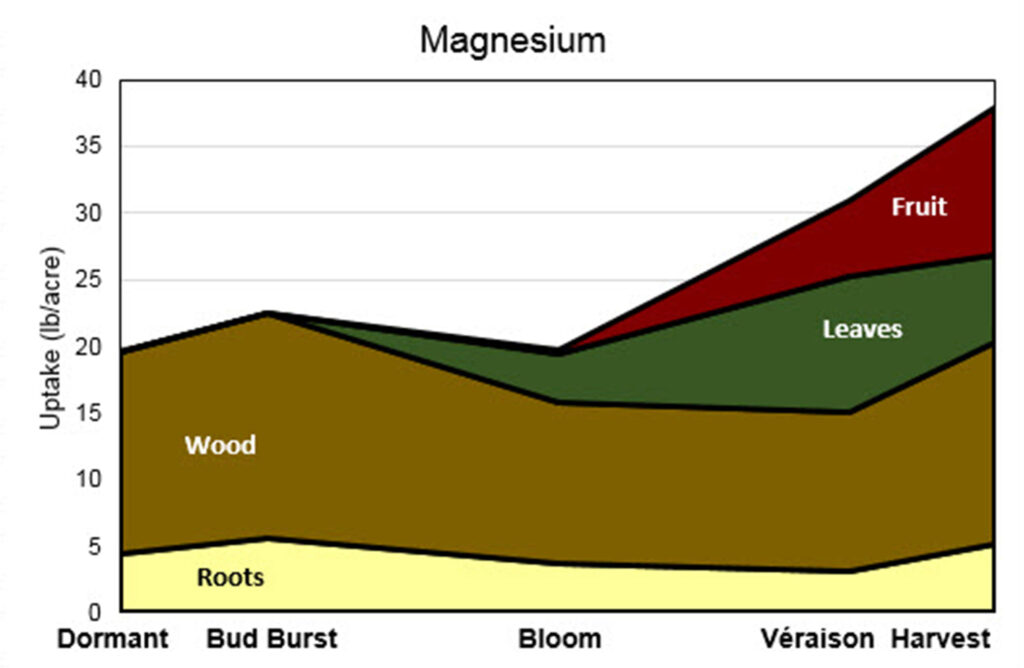
This stacked area graph is titled “Magnesium.” The y-axis is labeled “Uptake (lb/acre)” and ranges from 0 to 40 pounds per acre. The x-axis shows five growth stages: Dormant, Bud Burst, Bloom, Véraison, and Harvest.
Four plant components contribute to total magnesium uptake: Roots (light yellow), Wood (brown), Leaves (green), and Fruit (red).
Dormant: Total uptake is approximately 20 lb/acre. Most magnesium is stored in wood, with a smaller contribution from roots. There are no visible contributions from leaves or fruit.
Bud Burst: Total uptake increases slightly to about 22–23 lb/acre. Roots increase modestly, and wood remains the dominant component. Leaves and fruit are still minimal or absent.
Bloom: Total uptake decreases slightly to around 20 lb/acre. Wood declines compared to bud burst. Leaves begin contributing a small amount. Roots decrease slightly. Fruit is not yet a significant contributor.
Véraison: Total uptake increases to roughly 30 lb/acre. Leaves contribute more substantially. Fruit begins contributing magnesium at this stage. Wood remains important but continues a gradual decline relative to earlier stages. Roots remain a small portion.
Harvest: Total uptake reaches its highest level at approximately 37–38 lb/acre. Fruit and leaves make significant contributions. Wood increases again compared to véraison and remains a major component. Roots increase slightly but remain the smallest contributor.
Overall trend:
Magnesium uptake remains relatively stable from Dormant through Bloom, dips slightly at Bloom, and then increases steadily through Véraison to Harvest. Early in the season, magnesium is primarily associated with wood and roots. Later in the season, leaves and fruit become increasingly important sinks, with fruit contributing substantially by harvest, though wood remains a significant reservoir throughout.
Calcium
Calcium (Ca) is of integral importance to the strength and structure of plant cell walls. It also plays an important role in a plant’s ability to respond to various types of stress. Symptoms of deficiency are noted in Table 19.
Table 19. Symptoms on calcium (Ca) deficient vines.| - | Deficient |
|---|---|
| Symptoms | Stunted growth and small, pale green leaves. Brittle shoots. Lack of fruit. |
| Where (Plant) | Throughout. |
| Where (Vineyard) | Acidic soils (western WA typically low in Ca). Elevated sodium in irrigation water can cause Na-induced Ca deficiencies. |
| When | Season-long. |
Remediation
Pre-plant. Since Ca is rarely deficient in Washington soils when soil pH is in the neutral range (Figure 1), soil tests should be carried out west of the Cascades to determine pH. If the pH of your soil is found to be below 5.5, corrections can be made as described in the section on Adjusting Soil pH.
Established vineyards. When vines take up Ca and where it is stored is pictured in Figure 10. When whole leaf tissue test results indicate a deficiency in Ca, low rates of fertilizer can be applied either as a foliar spray or, more commonly, a soil application. Since the demand for Ca in grapevines peaks between the 3 to 4 leaf stage and the onset of véraison (Schreiner et al. 2006), early applications are optimal. One relatively simple remedy for Ca deficiencies is to utilize calcium nitrate for at least one of your N applications, which would provide a highly soluble and plant-available form of Ca. Alternatively, if plants are also low in boron (B), a calcium-boron (CaB) application can be used.
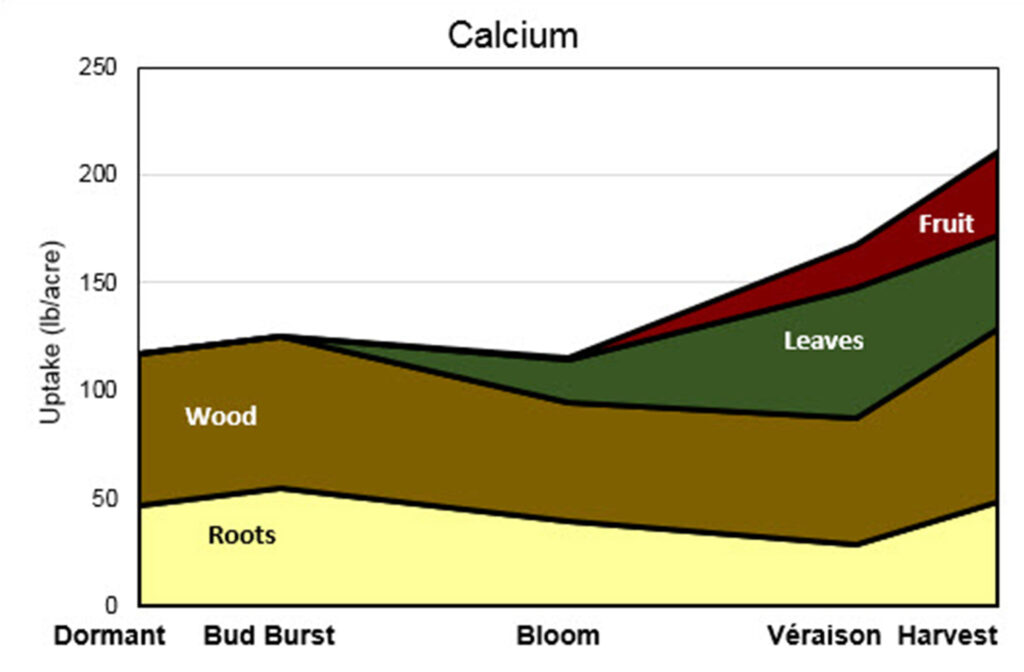
This stacked area graph is titled “Calcium.” The y-axis is labeled “Uptake (lb/acre)” and ranges from 0 to 250 pounds per acre. The x-axis shows five growth stages: Dormant, Bud Burst, Bloom, Véraison, and Harvest.
Four plant components contribute to total calcium uptake: Roots (light yellow), Wood (brown), Leaves (green), and Fruit (red).
Dormant: Total uptake is approximately 115–120 lb/acre. Most calcium is in wood, with a substantial portion in roots. Leaves and fruit are absent at this stage.
Bud Burst: Total uptake increases slightly to around 120–125 lb/acre. Roots increase modestly, and wood remains the largest contributor. Leaves and fruit are still minimal.
Bloom: Total uptake decreases slightly to about 110–115 lb/acre. Wood and roots both decline from bud burst levels. Leaves begin contributing a noticeable amount. Fruit is still minimal or absent.
Véraison: Total uptake increases to roughly 165 lb/acre. Leaves contribute substantially at this stage. Fruit begins accumulating calcium. Wood continues as a major component, while roots gradually decline compared to earlier stages.
Harvest: Total uptake reaches its maximum at approximately 205–210 lb/acre. Leaves and fruit contribute significant amounts. Wood remains a major reservoir, and roots increase again compared to véraison but remain smaller than wood.
Overall trend:
Calcium uptake is relatively high early in the season due to storage in roots and wood. After a slight dip at bloom, total uptake rises steadily through véraison to harvest. While wood and roots dominate early-season calcium storage, leaves become important during mid-season growth, and fruit contributes increasingly toward harvest. Unlike potassium, calcium remains strongly associated with structural tissues (wood and leaves) throughout the season, even as fruit uptake increases late in development.
Sulfur
Sulfur (S) serves many functions in plants, and is involved in the production of amino acids and proteins, as well as the formation of chlorophyll. Deficiencies (Table 20) are rather uncommon, as there is sufficient S in irrigation water to supply an adequate amount of this nutrient to grapevines. Furthermore, many common fertilizers used to supply other nutrients are in the sulfate form and thus provide a source of S.
Remediation
Pre-plant. Soil tests are not useful in high rainfall environments (west of the Cascade Mountains) due to leaching of sulfate. Soil tests can be useful in arid environments (east of the Cascade Mountains). If S is found to be low (less than 4 ppm), apply 40 lb S per acre to the soil.
Established vineyards. When vines take up S and where it is stored is pictured in Figure 11. In established vineyards, grapevines generally only require 4 to 8 lb of S per acre each year. Due to the prevalence of this nutrient in irrigation water and other types of applications, S fertilization is rarely necessary. However, if a deficiency is suspected based on foliar symptoms and soil test results (a critical range for S in plant tissue tests has not yet been established), S can either be applied to the foliage or soil in a sulfate (SO4) form. If N supplementation is also required, utilization of a sulfate form of N can be applied to the soil at rates described previously (this can be a solid product, but a soluble material is available for application through dirt irrigation systems). If N fertilization is not required, the most ideal sources of sulfate are MgSO4, KSO4, or KTS (potassium thiosulfate). The first two can be applied to the soil as a solid material. In addition, MgSO4 is highly soluble and KTS is a liquid product, thus either can be easily applied through drip irrigation systems.
Table 20. Symptoms on sulfur (S) deficient vines.| - | Deficient |
|---|---|
| Symptoms | Olive-green discoloration. Red or purple discoloration in red grape cultivars. |
| Where (Plant) | Basal leaves. |
| Where (Vineyard) | Areas receiving high rainfall (leaching of sulfate). |
| When | Mid-late season. |
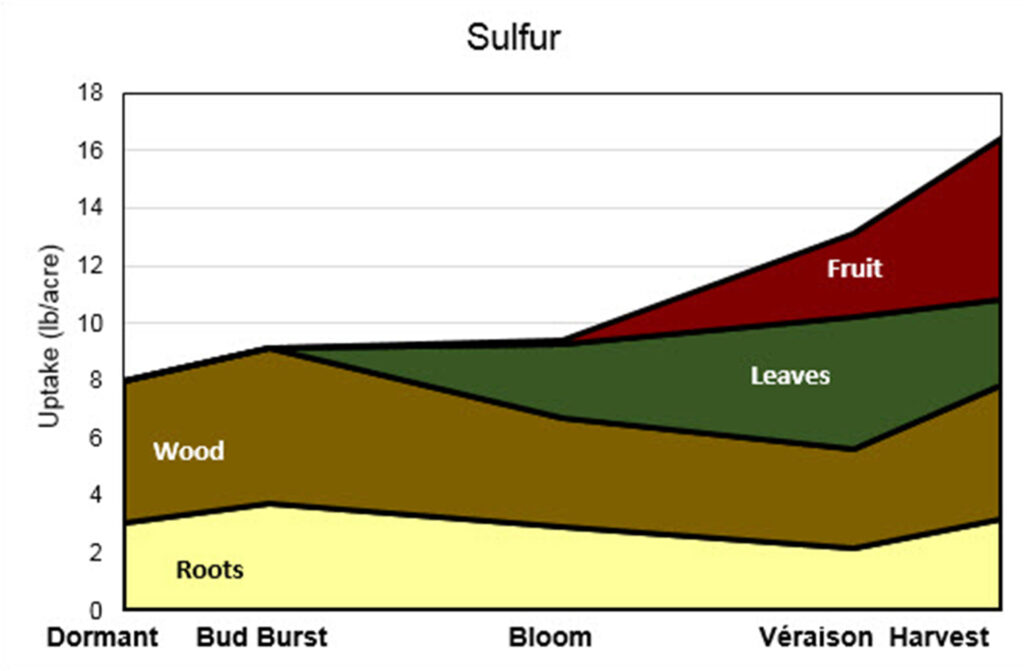
This stacked area graph is titled “Sulfur.” The y-axis is labeled “Uptake (lb/acre)” and ranges from 0 to 18 pounds per acre. The x-axis shows five growth stages: Dormant, Bud Burst, Bloom, Véraison, and Harvest.
Four plant components contribute to total sulfur uptake: Roots (light yellow), Wood (brown), Leaves (green), and Fruit (red).
Dormant: Total uptake is approximately 8 lb/acre. Most sulfur is in wood, with a smaller portion in roots. Leaves and fruit are not present.
Bud Burst: Total uptake increases slightly to around 9 lb/acre. Roots increase modestly, and wood remains the dominant contributor. Leaves and fruit are minimal or absent.
Bloom: Total uptake remains close to 9–9.5 lb/acre. Wood declines compared to bud burst. Leaves begin contributing a noticeable amount. Roots decrease slightly. Fruit is still negligible.
Véraison: Total uptake rises to approximately 13 lb/acre. Leaves contribute substantially at this stage. Fruit begins accumulating sulfur. Wood continues to decline gradually, and roots decrease slightly compared to earlier stages.
Harvest: Total uptake reaches its highest level at about 16–17 lb/acre. Fruit shows a strong increase and becomes a major contributor. Leaves remain significant. Wood increases somewhat compared to véraison, and roots increase slightly but remain the smallest component.
Overall trend:
Sulfur uptake is relatively low compared to other nutrients and increases gradually over the season. Early-season sulfur is largely associated with wood and roots. Leaves become important at bloom and véraison, and fruit becomes a major sink after véraison, contributing strongly by harvest.
Micronutrients
Boron
Boron (B) is an essential micronutrient that is required in only very small quantities for plant growth and development. One of the most important roles of B is that pollen tubes cannot develop on flowers with low B, which subsequently results in aborted fruit. It plays a regulatory function in the production of carbohydrates as well as cell division.
Deficiencies (Table 21) can impair or kill actively dividing cells such as those on shoot tips. While B deficiencies can cause serious consequences for growers, the over-application of this nutrient will result in plant toxicity (Table 21), which can also be quite severe.
Table 21. Symptoms on boron (B) deficient vines.| - | Deficient | Excess |
|---|---|---|
| Symptoms | Reduced fruit set. Lower yields. Shot berries (lacking seeds). Flower and cluster necrosis. Mottling of leaf veins progressing to necrosis. If previous fall and winter were dry: basal leaves have crinkled appearance with pronounced veins. | Stippled necrosis (measles) in the leaves. Necrosis of the leaf margins. Cupping of young leaves. |
| Where (Plant) | Foliar symptoms occur near the shoot tip (current season B deficiency). Basal leaves (if previous fall and winter were dry). | First symptoms appear on older leaves. |
| Where (Vineyard) | Alkaline soils. Acidic, sandy soils in high rainfall areas (leaching). Soils lacking organic matter. Drought-stressed vines. | - |
| When | Early to mid-season. | Early to mid-season. |
Remediation
Pre-plant. Where soil test values of extractable B are less than 0.5 ppm, 2 lb B can be soil-applied per acre.
Established vineyards. When vines take up B and where it is stored is pictured in Figure 12. Boron deficiency symptoms can resemble other vine disorders, such as Tomato ringspot virus infection, and can also result from poor weather during bloom or 2-4 D damage. Since the application of B can easily lead to phytotoxicity, symptoms should always be confirmed by leaf tissue analysis prior to making any amendments to your fertilization strategy. Unlike soil tests, tissue analyses are useful for detecting both deficiency and toxicity in B.
If a véraison-sampled tissue test indicates that B levels are low (less than 30 ppm), or even at the low end of normal (less than 50 ppm), a foliar application of B should be made early the following season. Grapevines require more B on a dry weight basis than the majority of other crops, and applications should consist of 1 lb B per acre. Make either a single spray two weeks pre-bloom, when clusters are visible but not yet open, or two applications, the first at 1/2 rate 2 weeks pre-bloom and the second also at 1/2 rate just as flowers start to open.
Boron products should not be tank mixed with certain fungicide and insecticide formulations that include a water-soluble packaging, as this can react with B to form an insoluble product. Furthermore, since most soluble B products are alkaline, reducing the pH with citric acid (follow label instructions) will be necessary if combining with a product that is pH-sensitive.
If a vineyard consistently shows symptoms of B deficiency, and B levels are known to be low, an annual maintenance pre-bloom spray may be of use. However, tissue tests should be conducted routinely to monitor B levels to ensure they do not increase above 100 ppm, thus preventing over-application.
Boron can also be applied to the soil, although the use of solid forms of B can be problematic, due to the difficulty of ensuring uniform applications of such small quantities. Soluble forms of B are superior, and can be applied to the soil before bud break or after leaf fall. Late season berm spray treatments have been found to be effective in situations with high rainfall (Peacock and Christensen n.d.). Also, while no formal trials have yet been carried out, applications of very small amounts of B (no more than 0.1 lb B per acre in a single application) 2 to 4 times a year via drip irrigation systems have been used successfully. Applications should take place between spring and early summer, and should be separated by at least two weeks (Peacock and Christensen n.d.).
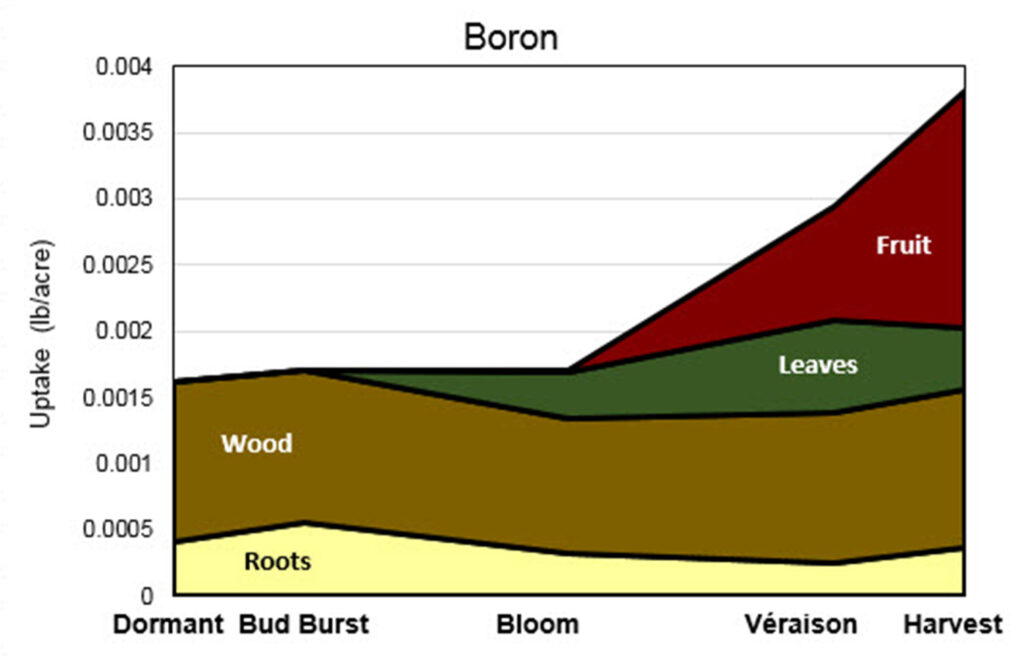
This stacked area graph is titled “Boron.” The y-axis is labeled “Uptake (lb/acre)” and ranges from 0 to 0.004 pounds per acre. The x-axis shows five growth stages: Dormant, Bud Burst, Bloom, Véraison, and Harvest.
Four plant components contribute to total boron uptake: Roots (light yellow), Wood (brown), Leaves (green), and Fruit (red).
Dormant: Total uptake is approximately 0.0016 lb/acre. Most boron is in wood, with a smaller portion in roots. Leaves and fruit are not present.
Bud Burst: Total uptake increases slightly to about 0.0017 lb/acre. Roots increase modestly, and wood remains the dominant component. Leaves and fruit are minimal or absent.
Bloom: Total uptake remains similar (around 0.0017 lb/acre). Wood declines somewhat from bud burst levels. Leaves begin contributing a small amount. Roots decrease slightly. Fruit is negligible.
Véraison: Total uptake increases to approximately 0.0029 lb/acre. Fruit begins accumulating boron and contributes significantly. Leaves increase moderately. Wood remains steady, and roots continue to represent the smallest share.
Harvest: Total uptake reaches its maximum at roughly 0.0038–0.004 lb/acre. Fruit becomes the largest contributor, showing the greatest increase. Leaves contribute moderately. Wood remains relatively stable, and roots increase slightly compared to véraison but remain minor.
Overall trend:
Boron uptake is very small compared to macronutrients and remains relatively stable from Dormant through Bloom. After véraison, total uptake rises sharply, driven largely by accumulation in fruit. Early-season boron is primarily associated with wood and roots, while fruit becomes the dominant sink by harvest.
Zinc
Zinc (Zn) is crucial for the process of pollination as well as the formation of chloroplasts and plant hormones. Deficiency symptoms are noted in Table 22.
Table 22. Symptoms on zinc (Zn) deficient vines.| - | Deficient |
|---|---|
| Symptoms | Reduced fruit set. Shot berries. Small berries remain green and never ripen. Small leaves, pale interveinal color. Pale leaf veins. Wide petiole sinuses. Stunted shoots, short internodes, increased lateral shoots. |
| Where (Plant) | Leaf symptoms appear on the oldest leaves first. |
| Where (Vineyard) | Shallow, sandy soils. Calcareous soils (high pH soils). Often with Fe deficiency. |
| When | Fruit set. |
Remediation
Pre-plant. When soil tests indicate Zn levels of less than 0.8 ppm, amendments can be made by plowing under 20 to 30 lb Zn per acre.
Established vineyards. When vines take up Zn and where it is stored is pictured in Figure 13. Symptoms of Zn deficiency can be confused with damage from herbicides or viral infections, weather extremes at bloom, excessive N, and boron deficiency. Therefore, tissue tests should be conducted to confirm the diagnosis. Avoid sampling leaves that have been treated with foliar sprays containing Zn; samples should always be collected prior to any such sprays, even if it means sampling before bloom. Soil tests are of little value in determining Zn additions in established vineyards since the range of soil Zn concentrations is very narrow and many other factors affect its uptake by roots and requirements by vines.
Zinc should be applied as a foliar spray (Table 23). Since Zn is readily fixed in the soil, applications to the soil would necessitate very high fertilizer rates, as much of the Zn would quickly become unavailable to plants. When applying foliar sprays, both the upper and lower sides of the foliage should be targeted to aid in absorption.
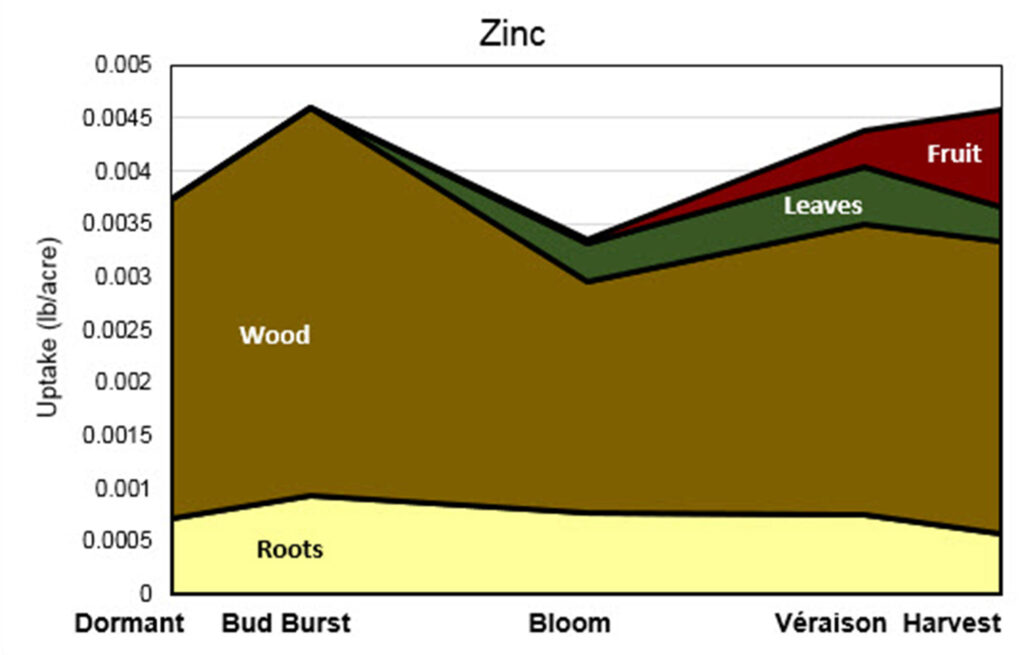
This stacked area graph is titled “Zinc.” The y-axis is labeled “Uptake (lb/acre)” and ranges from 0 to 0.005 pounds per acre. The x-axis shows five growth stages: Dormant, Bud Burst, Bloom, Véraison, and Harvest.
Four plant components contribute to total zinc uptake: Roots (light yellow), Wood (brown), Leaves (green), and Fruit (red).
Dormant: Total uptake is approximately 0.0037–0.0038 lb/acre. Most zinc is stored in wood, with a smaller amount in roots. Leaves and fruit are not present.
Bud Burst: Total uptake reaches its highest early-season level at about 0.0045–0.0046 lb/acre. Both roots and wood increase, with wood remaining the dominant component. Leaves and fruit are still negligible.
Bloom: Total uptake declines to around 0.0033 lb/acre. Wood decreases noticeably from bud burst levels. Roots decline slightly. Leaves begin contributing a modest amount. Fruit is minimal or absent.
Véraison: Total uptake increases to roughly 0.0043–0.0044 lb/acre. Leaves contribute more substantially. Fruit begins accumulating zinc. Wood remains the largest contributor, and roots remain relatively stable.
Harvest: Total uptake reaches about 0.0046 lb/acre. Fruit increases further and becomes a meaningful contributor. Leaves remain moderate. Wood remains the dominant component overall, while roots decline slightly compared to earlier stages.
Overall trend:
Zinc uptake is very low compared to macronutrients. It peaks at bud burst, declines at bloom, and then increases gradually through véraison and harvest. Wood serves as the primary reservoir throughout the season. Leaves and fruit contribute later in development, with fruit becoming increasingly important by harvest.
| Materials & Formulations | Per 100 Gallons | Per Acre | Remarks |
|---|---|---|---|
| zinc sulfate 36% crystals | 1.0 lb | 1.0 lb | 100 gallons/acre 2 weeks pre-bloom, 300 gallons/acre 2 weeks post-bloom. Apply with ferrous sulfate if chlorosis is evident. |
| zinc sulfate 1.2 pounds/gallon LC | 0.3 gal | 0.3 gal | Spray upper and lower sides of leaves thoroughly for maximum absorption. |
Iron
Iron (Fe) plays a very important role in plants, as it is an absolute necessity for the production of chlorophyll. Without chlorophyll, plants would not be able to carry out photosynthesis. Deficiency symptoms are noted in Table 24.
Remediation
Pre-plant. Soil tests for Fe are not recommended, as they do not discriminate between different forms. They therefore have little relevance on nutrition management decisions. Instead, soil should be tested for pH and adequate drainage should be ensured.
Established vineyards. When vines take up Fe and where it is stored is pictured in Figure 14. Iron deficiencies are by far the most difficult nutrient deficiency to remedy since this nutrient exhibits very little or no translocation in the plant to different growing regions. Similar to soil testing for iron, tissue tests are also not always helpful because Fe deficient tissues are not necessarily low in Fe. This is because deficiencies are often caused by its immobilization in plant tissues rather than a lack of total uptake.
While foliar applications (Table 25) of Fe chelates or Fe sulfate (FeSO4) can relieve chlorosis symptoms, these results are temporary and last only a single growing season. When sprays are carried out, they should be applied twice in a growing season, as is the case for zinc: once approximately two weeks prior to bloom and again two weeks after bloom. In the case of iron chelates, label rates should not be exceeded.
Table 24. Symptoms on iron (Fe) deficient vines.| - | Deficient |
|---|---|
| Symptoms | Interveinal chlorosis (yellowing) of the leaves. |
| Where (Plant) | Youngest leaves show first symptoms. |
| Where (Vineyard) | Rare on acidic soils. Common on calcareous soils with high pH (hence name of “lime-induced chlorosis”). Vineyards with high water table, poor drainage, or over-irrigation. Vineyards where water source is high in bicarbonate. In juice grapes this disorder is more pronounced in cool wet springs. |
| When | Early to mid-season. |
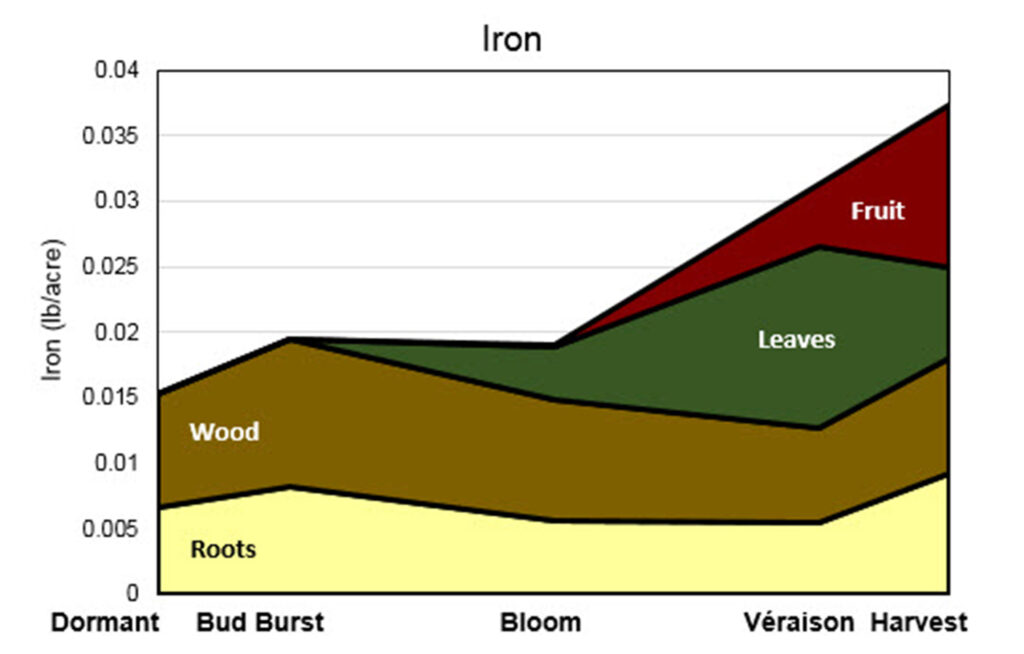
This stacked area graph is titled “Iron.” The y-axis is labeled “Iron (lb/acre)” and ranges from 0 to 0.04 pounds per acre. The x-axis shows five growth stages: Dormant, Bud Burst, Bloom, Véraison, and Harvest.
Four plant components contribute to total iron uptake: Roots (light yellow), Wood (brown), Leaves (green), and Fruit (red).
Dormant: Total uptake is approximately 0.015–0.016 lb/acre. Wood is the largest contributor, followed by roots. Leaves and fruit are not present.
Bud Burst: Total uptake increases to about 0.019–0.020 lb/acre. Both roots and wood increase slightly, with wood remaining dominant. Leaves and fruit are minimal or absent.
Bloom: Total uptake declines slightly to around 0.019 lb/acre. Wood decreases compared to bud burst. Roots decline modestly. Leaves begin contributing a noticeable amount. Fruit is negligible.
Véraison: Total uptake increases to approximately 0.026–0.027 lb/acre. Leaves contribute substantially. Fruit begins accumulating iron. Wood continues to decline relative to earlier stages, and roots remain relatively stable.
Harvest: Total uptake reaches its highest level at roughly 0.036–0.037 lb/acre. Fruit shows a strong increase and becomes a major contributor. Leaves remain significant. Wood increases again compared to véraison, and roots also increase, though both remain smaller contributors than fruit at this stage.
Overall trend:
Iron uptake is low compared to macronutrients but increases overall through the growing season. After a slight dip at bloom, uptake rises steadily from véraison to harvest. Early-season iron is primarily stored in wood and roots, while leaves and fruit become increasingly important sinks later in development, with fruit contributing strongly by harvest.
| Materials & Formulations | Per 100 Gallons | Per Acre | Remarks |
|---|---|---|---|
| Iron sulfate | 3.0 lb | 3.0-9.0 lb | Treatment can make vines green but may not correct the problem. |
| Iron chelates or organic complexes | Do not exceed label rates. | - | - |
| Combine ferrous sulfate with above zinc sulfate treatment if zinc deficiency symptoms are present | - | - | Dissolve zinc and iron compounds in water separately before dumping into spray tank. Add ferrous sulfate last. Dissolve in cold water, mix in spray tank, and spray immediately. |
| Several commercial products for application of foliar nutrients are also available | - | - | Foliar applications during high temperatures can burn leaves. |
Soil applications can be used; however, it can be problematic in alkaline soils. Iron salts (such as FeSO4) will not remain plant-available in soils with a high pH (Figure 1) and thus will not function as a useful source of Fe. While a large-scale lowering of soil pH is not an economical option, the addition of acidifying materials such as elemental S to the iron salt fertilizer can enhance the availability of Fe.
A more effective means of delivering additional Fe to the soil is through the use of chelated iron fertilizers; however, they are expensive. For juice grapes exhibiting iron chlorosis, the most effective way to alleviate chlorosis is soil application of liquid (solubilized) iron EDDHA in two applications of 32 lb/acre, with the first just prior to or at bud burst and the second at bloom, for a total of 64 lb/acre. If the vineyard is mapped for chlorotic versus unaffected areas, the material can be applied to affected zones only.
Copper
Copper (Cu) plays a role in chlorophyll synthesis and is also a promoter for electron transport in the plant. Deficiency symptoms are noted in Table 26.
Table 26. Symptoms on copper (Cu) deficient vines.| - | Deficient |
|---|---|
| Symptoms | Small leaf size. Shoot tip resetting. Stunted shoots, short internodes, increased lateral shoots. |
| Where (Plant) | Symptoms appear on the youngest leaves and shoot tips. |
| Where (Vineyard) | Shallow, sandy soils. Calcareous soils (high pH soils). |
| When | Early to mid-season. |
Remediation
Pre-plant. When soil tests indicate Cu levels of less than 0.5 ppm, amendments can be made by plowing under 5 to 10 lb Zn per acre.
Established vineyards. When vines take up Cu and where it is stored is pictured in Figure 15. Symptoms of Cu deficiency are rare in vineyards but can occur. Tissue tests should be conducted when leaves are undersized and new growth is stunted to confirm the diagnosis. Avoid sampling leaves that have been treated with foliar sprays containing Cu. Soil tests are of little value in determining the need for Cu in established vineyards since the range of soil Cu concentrations is very narrow and many other factors affect its uptake by roots.
Copper should be applied as a foliar spray using copper sulfate (0.5 lb/acre) or chelated copper (refer to label for rates) in a single application at late bloom. Since Cu is readily fixed in the soil, applications to the soil would necessitate very high fertilizer rates, as much of the Cu would quickly become unavailable to plants. When applying foliar sprays, both the upper and lower sides of the foliage should be targeted to aid in absorption.
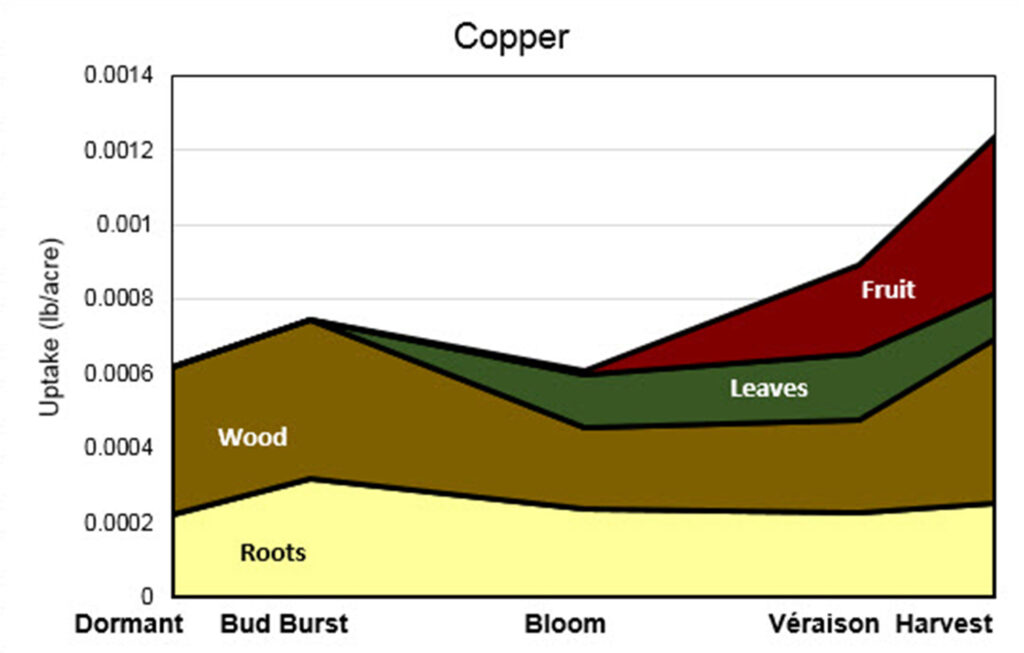
This stacked area graph is titled “Copper.” The y-axis is labeled “Uptake (lb/acre)” and ranges from 0 to 0.0014 pounds per acre. The x-axis shows five growth stages: Dormant, Bud Burst, Bloom, Véraison, and Harvest.
Four plant components contribute to total copper uptake: Roots (light yellow), Wood (brown), Leaves (green), and Fruit (red).
Dormant: Total uptake is approximately 0.0006 lb/acre. Wood is the largest contributor, followed by roots. Leaves and fruit are not present.
Bud Burst: Total uptake increases to around 0.0007–0.00075 lb/acre. Both roots and wood increase slightly, with wood remaining dominant. Leaves and fruit are negligible.
Bloom: Total uptake declines to roughly 0.0006 lb/acre. Wood decreases noticeably compared to bud burst. Roots decline slightly. Leaves begin contributing a modest amount. Fruit is minimal.
Véraison: Total uptake rises to about 0.00085–0.0009 lb/acre. Leaves contribute more substantially. Fruit begins accumulating copper. Wood remains a major component, and roots remain relatively stable.
Harvest: Total uptake reaches its maximum at approximately 0.0012–0.0013 lb/acre. Fruit increases sharply and becomes a major contributor. Leaves remain moderate. Wood increases again compared to véraison, and roots increase slightly but remain the smallest contributor.
Overall trend:
Copper uptake is very low compared to macronutrients. It rises slightly at bud burst, dips at bloom, and then increases steadily through véraison to harvest. Early in the season, copper is primarily associated with wood and roots. Later in development, leaves and especially fruit become increasingly important sinks, with fruit showing the strongest late-season increase.
Manganese
Manganese (Mn) plays a role in plant nitrogen metabolism and chlorophyll function. Deficiency symptoms are noted in Table 27.
Table 27. Symptoms on manganese (Mn) deficient vines.| - | Deficient |
|---|---|
| Symptoms | Blotchy interveinal chlorosis on older leaves. Tissue around the major and secondary veins remains dark green. Severe deficiency will result in interveinal necrosis on older leaves. |
| Where (Plant) | Typically on basal leaves first. |
| Where (Vineyard) | Soils high in lime content are often more likely to induce manganese deficiency symptoms. Sandy soils or areas of high rainfall can also induce deficiency symptoms. |
| When | Mid-season. |
Remediation
Pre-plant. When soil tests indicate Mn levels of less than 10 ppm, amendments can be made by plowing under 4 lb Mn per acre.
Established vineyards. When vines take up Mn and where it is stored is pictured in Figure 16. Symptoms of Mn deficiency are rare in vineyards but can occur. Tissue tests should be conducted when symptoms noted above are seen to confirm the diagnosis.
When deficient, Mn should be applied as a foliar spray of manganese sulfate at 2 to 3 lb per 100 gallons water or as manganese chelate at 1 to 2 lb per 100 gallons of water. Application should occur around bloom. When applying foliar sprays, both the upper and lower sides of the foliage should be targeted to aid in absorption
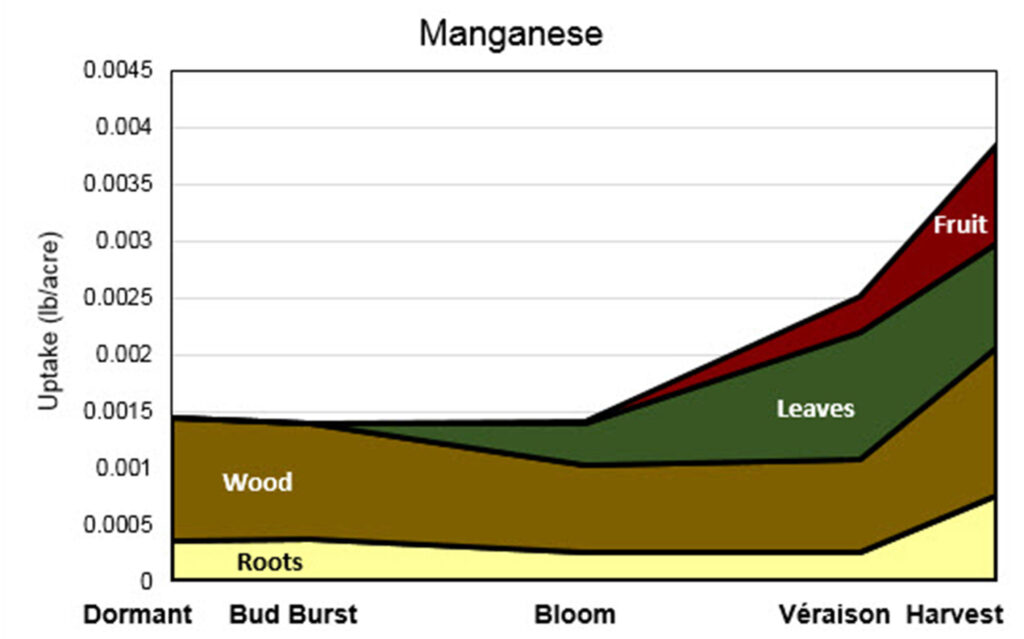
This stacked area graph is titled “Manganese.” The y-axis is labeled “Uptake (lb/acre)” and ranges from 0 to 0.0045 pounds per acre. The x-axis shows five growth stages: Dormant, Bud Burst, Bloom, Véraison, and Harvest.
Four plant components contribute to total manganese uptake: Roots (light yellow), Wood (brown), Leaves (green), and Fruit (red).
Dormant: Total uptake is approximately 0.0014–0.0015 lb/acre. Wood is the largest contributor, followed by roots. Leaves and fruit are not present.
Bud Burst: Total uptake remains similar or slightly lower (around 0.0014 lb/acre). Roots and wood are the primary components, with wood dominant. Leaves and fruit are negligible.
Bloom: Total uptake remains near 0.0014 lb/acre. Wood decreases slightly compared to earlier stages. Leaves begin contributing a small amount. Roots decline modestly. Fruit is minimal.
Véraison: Total uptake increases to about 0.0025 lb/acre. Leaves contribute substantially at this stage. Fruit begins accumulating manganese. Wood remains significant but proportionally smaller than earlier in the season. Roots remain minor.
Harvest: Total uptake reaches approximately 0.0038–0.004 lb/acre. Fruit shows a strong increase and becomes a major contributor. Leaves remain important. Wood increases again compared to véraison, and roots increase modestly but remain the smallest component.
Overall trend:
Manganese uptake is very low compared to macronutrients and remains relatively stable from Dormant through Bloom. After bloom, uptake increases steadily through véraison and harvest. Early-season manganese is primarily stored in wood and roots, while leaves and fruit become increasingly important sinks later in development, with fruit showing strong accumulation by harvest.
| - | Wooly Bud to Budburst | 3 to 4 Leaf Stage | Pre-Bloom | Bloom | Post-Bloom / Fruitset | Véraison |
|---|---|---|---|---|---|---|
| Nitrogen (N) (wine grapes) | - | - | - | X | X | X |
| Nitrogen (N) (juice grapes) | X | - | - | X | - | X |
| Phosphorus (P) | - | X | X | X | X | X |
| Potassium (K) | - | X | X | X | - | - |
| Sulfur (S) | - | X | X | X | - | - |
| Magnesium (Mg) | - | X | X | X | - | - |
| Calcium (Ca) | X | X | - | - | - | - |
| Manganese (Mn) | - | X | X | X | - | - |
| Boron (B) | - | - | X | - | - | - |
| Zinc (Zn) | - | - | X | X | - | - |
| Iron (Fe) | - | - | X | - | X | - |
| Copper (Cu) | - | - | - | X | X | - |
References
Brady, N.C., and R.R. Weil. 2010. Elements of the Nature and Properties of Soils, 3rd ed. Pearson AG Publishing. p. 624.
California Fertilizer Foundation (CFR). 1995. Western Fertilizer Handbook, 8th ed. Interstate Publishers, Danville, IL.
p. 219.
Christensen, L.P., and W.L. Peacock. 2000. Chapter 14: Mineral Nutrition and Fertilization. In Raisin Production Manual. L.P. Christensen, ed. University of California Division of Agriculture and Natural Resources Publication 3393.
Christensen, P. 1969. Use of Tissue Analysis in Viticulture. University of California Cooperative Extension Publication NG10-0.
Christensen, P. 1984. Nutrient Level Comparisons of Leaf Petioles and Blades in Twenty-six Grape Cultivars over Three Years (1979 through 1981). American Journal of Enology and Viticulture 35: 124–133.
Cogger, C. 2005. Home Gardener’s Guide to Soils and Fertilizers. Washington State University Extension Publication EM063E.
Collins, D., C. Miles, C. Cogger, and R. Koenig. 2013. Soil Fertility in Organic Systems: A Guide for Gardeners and Small Acreage Farmers. Pacific Northwest Extension Publication PNW646.
Davenport, J. 2013. Grape Nutrient Deficiencies. In Field Guide for Integrated Pest Management in Pacific
Northwest Vineyards. Pacific Northwest Extension Publication PNW644. p. 109–112.
Davenport, J.R., and D.A. Horneck. 2011. Sampling Guide for Nutrient Assessment of Irrigated Vineyards in the Inland Pacific Northwest. Pacific Northwest Extension Publication PNW622. [OUT OF PRINT.]
Davenport, J.R., J.D. Lunden, and T. Winkler. 2012. Wine Grape Tissue Nutrient Concentrations in the Inland Pacific Northwest. Communications in Soil Science and Plant Analysis 43: 21–27.
Davenport, J.R., R.G. Stevens, and M. Keller. 2011. Micronutrient Supplements for Concord Grape – Final Report. Washington State Concord Grape Research Council.
Dow, A.I., W.J. Clore, A.R. Halvorson, and R.B. Tukey.1983. Fertilizer Guide for Irrigated Vineyards. Washington State University Extension Publication FG-13. [OUT OF PRINT.]
Davenport, J. 2016. Vineyard Nutrition. In Pest Management Guide for Grapes in Washington. G.A. Hoheisel and M.M. Moyer, eds. Washington State University Extension Publication EB0762. Pullman, WA. [Nutrition Section now OUT OF PRINT.]
Horneck, D., D. Wysocki, B. Hopkins, J. Hart, and R. Stevens. 2007. Acidifying Soil for Crop Production: Inland Pacific Northwest. Pacific Northwest Extension Publication PNW599. [OUT OF PRINT.]
Horneck, D.A., J.W. Ellsworth, B.G. Hopkins, D.M. Sullivan, and R.G. Stevens. 2007. Managing Salt-Affected Soils for Crop Production. Pacific Northwest Extension Publication PNW601. [OUT OF PRINT.]
Olmstead, M., J. Davenport, and R. Smithyman. 2005. Black Leaf in Grapes. Washington State University Extension Publication EB0745E.
Peacock, B., and P. Christensen. n.d. Boron Fertilization in Vineyards. University of California Cooperative Extension Tulare County Publication #NG8-99.
Poling, B., and S. Spayd. 2015. Chapter 9: Vine Nutrition. In The North Carolina Winegrape Grower’s Guide. North Carolina Cooperative Extension. Raleigh, NC.
Pradubsuk, S. and J.R. Davenport. 2010. Seasonal Uptake and Partitioning of Macronutrients in Mature ‘Concord’ Grape. Journal of the American Society for Horticultural Science 135(5): 474-483. 2010.
Pradubsuk, S. and J.R. Davenport. 2011. Seasonal Distribution of Micronutrients in Mature ‘Concord’ Grape: Boron, Iron, Manganese, Copper, and Zinc. Journal of the American Society for Horticultural Science 135: 69-77.
Richards, L.A., ed. 1954. Diagnosis and Improvement of Saline and Alkali Soils – Agriculture Handbook No. 60. United States Department of Agriculture. p. 166.
Schreiner R.P., C.F. Scagel, and J. Baham. 2006. Nutrient Uptake and Distribution in a Mature ‘Pinot noir’ Vineyard. HortScience 41: 336–345.
Skinkis, P.A., and R.P. Schreiner. 2011. Grapevine Nutrition Module. Oregon State University Extension Publication EM9024. [OUT OF PRINT.]
Staben, M.L., J.W. Ellsworth, D.M. Sullivan, D. Horneck, B.D. Brown, and R.G. Stevens. 2003. Monitoring Soil Nutrients Using a Management Unit Approach. Pacific Northwest Extension Publication PNW570.
Sullivan, D.M. 2015. Estimating Plant-Available Nitrogen from Manure. Oregon State University Extension Publication EM8954.
Weir, R.G., and G.C. Cresswell. 1993. Plant Nutrient Disorders, 1: Temperate and Subtropical Fruit and Nut Crops. Melbourne, Australia: Inkata Press.
Whiting, D., A. Card, C. Wilson, J. Reeder, and D. Goldhamer. 2015. Understanding Fertilizers. Colorado Master Gardener Program GardenNotes 232. Colorado State University.
Vossen, P. n.d. Changing pH in Soil. In Soil Information. Vegetable Research & Information Center, University of California Cooperative Extension Website. https://vric.ucdavis.edu/.
By,
Dr. Michelle M. Moyer, Viticulture Extension Specialist, Washington State University
Dr. Stacy D. Singer, Research Scientist, Agriculture and Agri-Food Canada
Dr. Joan R. Davenport, Crop and Soil Scientist, Washington State University
Gwen-Alyn Hoheisel, Regional Tree and Small Fruits Extension Specialist, Benton County Extension Director, Washington State University

EM111E

Copyright © Washington State University
WSU Extension publications contain material written and produced for public distribution. Alternative text descriptions for select complex images were generated using ChatGPT (OpenAI), then reviewed and adapted to ensure compliance with Web Content Accessibility Guidelines (WCAG) accessibility standards.
Issued by Washington State University Extension and the US Department of Agriculture in furtherance of the Acts of May 8 and June 30, 1914. Extension programs and policies are consistent with federal and state laws and regulations on nondiscrimination regarding race, sex, religion, age, color, creed, and national or ethnic origin; physical, mental, or sensory disability; marital status or sexual orientation; and status as a Vietnam-era or disabled veteran. Evidence of noncompliance may be reported through your local WSU Extension office. Trade names have been used to simplify information; no endorsement is intended.