Woody Debris Microsites Enhance Conifer Seedling Survival During Extreme Summer Heat
Description
Fallen dead wood has often been considered a nuisance and a fire hazard, but many now recognize its ecological value for wildlife habitat, nutrient cycling, and moisture retention. Learn about the “microsite effect” and how planting tree seedlings near fallen logs can increase their chances of survival.Table of Contents
Introduction
The seedling stage of development is often the time of greatest stress and mortality for forest trees. High soil surface temperatures in late summer, and associated low soil moisture, kill many planted seedlings. Herbivory from deer and rodents, along with pathogen pressure, also negatively impact seedling survival. At low elevations and in the dry regions east of the Cascade Range, late summer can be a period of significant stress for planted conifer stock. For those who have invested the time and resources to plant trees following timber harvest, fire, or other disturbance, practices that reduce these stressors can help improve seedling survival.
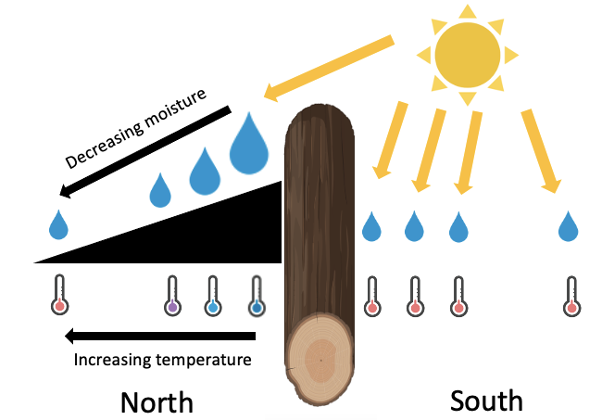
Down woody debris (DWD) is defined as fallen dead wood that is usually greater than 7.6 cm (3 in) diameter. While DWD has often been considered a nuisance and a fire hazard, modern day natural resource managers and scientists now recognize its ecological value, including wildlife habitat enrichment, nutrient cycling, and moisture retention. Additionally, DWD physically modifies its immediate surroundings, changing temperatures, soil moisture, and other variables that affect the growing environment for plants (Figure 1). This is known as the “microsite effect” (Heinemann and Kitzberger 2006). With the frequency of heat wave events in the Pacific Northwest expected to increase (White et al. 2023), accounting for microsite conditions when planting tree seedlings can increase the probability of survival.
This Extension publication describes the Log-Aspect Microsite Project (LAMP) (Swanson et al. 2023), a study which evaluated the function of DWD in creating cooler, moister conditions for planted seedlings of two conifer species, ponderosa pine (Pinus ponderosa; hereafter PP) and interior Douglas-fir (Pseudotsuga menziesii subsp. glauca; hereafter DF). In this study, survival and growth of planted seedlings based on their distance and orientation relative to experimentally placed DWD was examined, as was topography (slope and aspect) in relation to the microsite effect.
Methodology
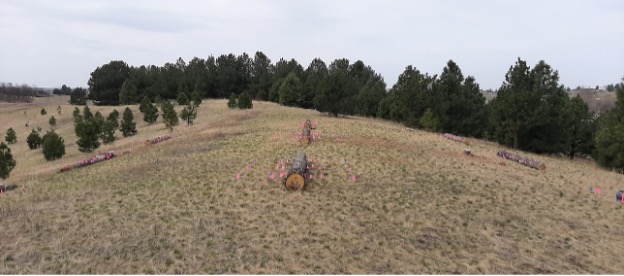
In this study, nine DWD segments were placed on a south-facing slope, flat treeless ridgetop, and north-facing slope at the E.H. Steffen Center, Washington State University, Pullman, Washington (46.7308°N, 117.1266°W, elevation 2,600 feet) (Figure 2). Each DWD measured at least 40 cm (16 in) in small end diameter and 5 m (16 ft) in length. All DWD segments were oriented east–west (parallel with the ridgetop), creating a north and a south side to each segment. On both sides of each DWD segment, three transects of seedlings were planted perpendicular to the DWD. Each transect consisted of four seedlings of PP and DF, planted at each of the following distances from the DWD: 0 m (0 ft; dripline of the DWD), 0.25 m (0.82 ft), 0.5 m (1.64 ft), and 1.5 m (4.92 ft) (Figure 3). Over two growing seasons (May to October), monthly measurements of soil moisture (%, measured at 20 cm depth), soil surface temperature, seedling diameter, seedling height, seedling survival, and seedling vigor class (1 = vigorous, 2 = somewhat reduced vigor, 3 = low vigor, 4 = dead) were recorded.
Results
Seedlings of both species fared better when planted at 0 m (0 ft) and 0.25 m (0.82 ft) on the north side of DWD compared to the south side of DWD, or at 0.5 m (1.64 ft) and 1.5 m (4.92 ft) on either side. High-vigor seedlings (vigor rating 1) were primarily located on the north side and within 0.25 m (0.82 ft) of DWD (Figure 4). Other locations had a far greater proportion of low-vigor and dead seedlings. The drought-tolerant PP was more successful outside of the immediate north side of logs, while DF, a conifer typical of cooler, moister sites, was much more tightly restricted to the north side and nearer locations.
The microsite effect was less pronounced on the north-facing slope, showing that protection from heat and sunlight is less important on a slope that faces away from the sun. On the south-facing slope and the flat ridgetop, however, the microsite effect was critical for ensuring seedling survival.
Moisture and temperature trends across slopes and in relation to DWD, as well as species’ specific tolerances, help explain the tree seedling response (Figure 5). Shade from DWD has a positive impact on late-summer soil moisture and keeps soil surface temperatures far below lethal levels, which is particularly important to the more mesic DF.
Conclusions
Microsites associated with DWD are characterized by cooler, moister conditions during the growing season that enhance seedling survival if utilized properly. To optimize the microsite benefit, one should plant accordingly:
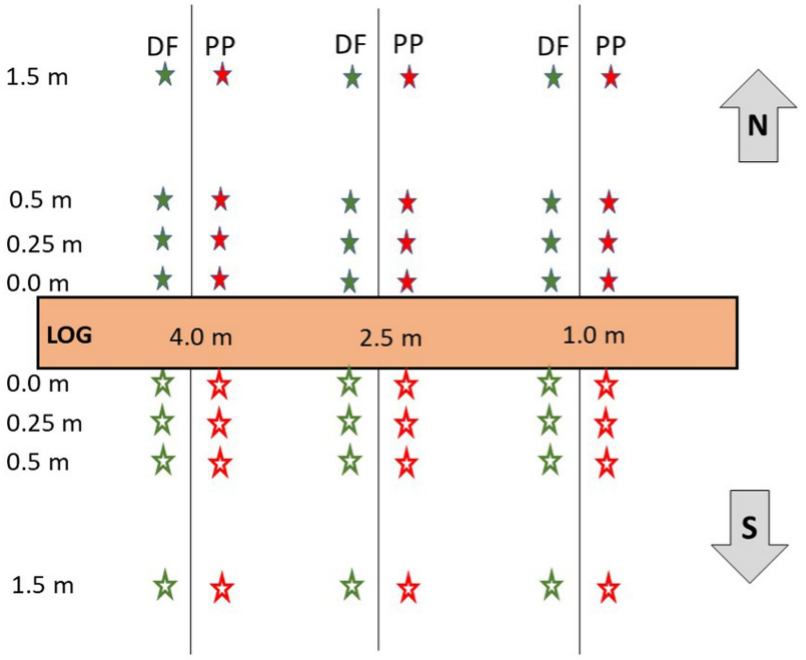
Diagram showing the layout of conifer seedling sampling locations around a fallen log. A horizontal rectangle labeled “LOG” runs across the center of the figure, with distances marked along the log at 4.0 m, 2.5 m, and 1.0 m. Vertical transect lines extend above and below the log at each distance point. Red star symbols labeled “PP” represent ponderosa pine seedlings, and green star symbols labeled “DF” represent Douglas-fir seedlings. Seedlings are positioned at distances of 0.0 m, 0.25 m, 0.5 m, and 1.5 m north and south of the log. An arrow labeled “N” points upward on the right side of the figure, and an arrow labeled “S” points downward below it.
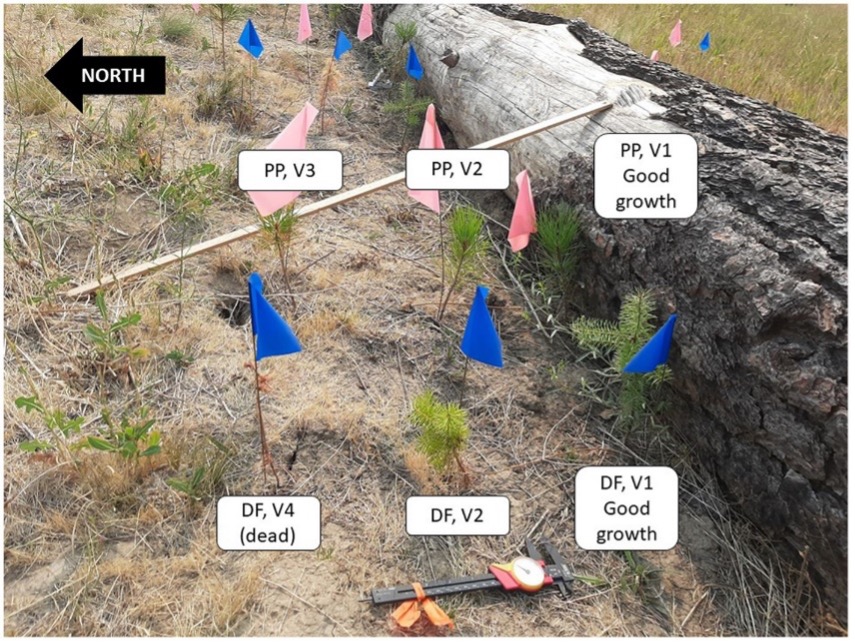
Photo of a forest regeneration monitoring plot showing young conifer seedlings marked with colored flags beside a fallen log. A black arrow labeled “North” points left in the upper-left corner. Pink flags identify ponderosa pine (PP) seedlings and blue flags identify Douglas-fir (DF) seedlings. Labels note seedling conditions and positions, including “PP, V1 Good growth,” “PP, V2,” “PP, V3,” “DF, V1 Good growth,” “DF, V2,” and “DF, V4 (dead).” A measuring caliper lies on the ground near the bottom center of the image. Dry grass and soil surround the seedlings.
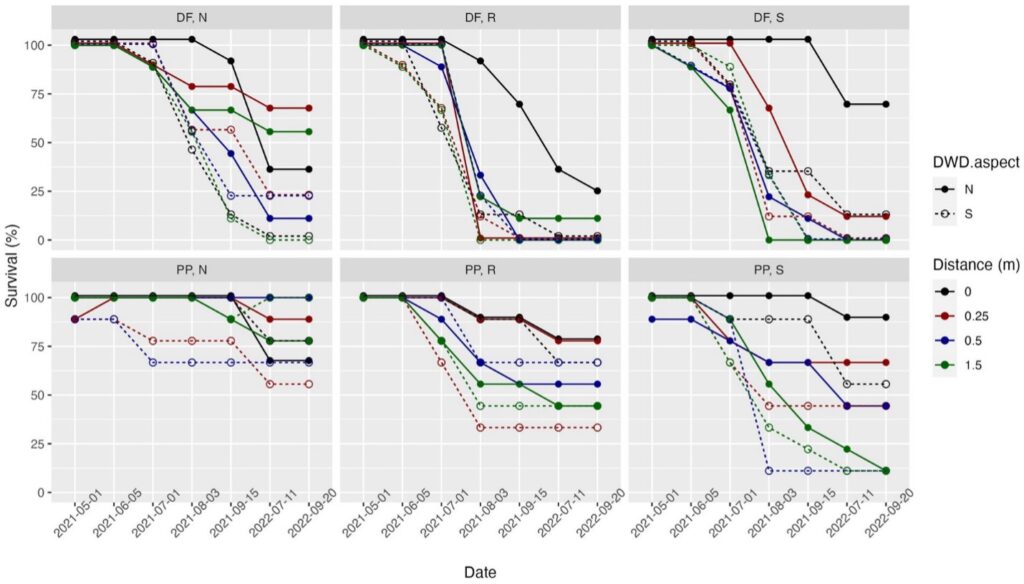
Figure 5 is a six-panel line graph showing percent survival over time for two groups of woody debris (“DWD.aspect”: N and S) under four distance treatments (0, 0.25, 0.5, and 1.5 meters). The figure is arranged in a 2-by-3 grid.
Layout and panel structure
- Columns represent three site or treatment categories labeled:
- “DF, N”
- “DF, R”
- “DF, S”
- Bottom row panels are:
- “PP, N”
- “PP, R”
- “PP, S”
The y-axis is labeled “Survival (%)” and ranges from 0 to slightly above 100.
The x-axis is labeled “Date” and includes repeated dates spanning from May 2021 through September 2022.
Line styles and colors
Two line styles represent DWD aspect:
- Solid lines with filled circles = aspect “N”
- Dashed lines with open circles = aspect “S”
Four colors represent distance treatments:
- Black = 0 m
- Red = 0.25 m
- Blue = 0.5 m
- Green = 1.5 m
Overall trends
Across most panels:
- Survival begins near 100% in spring and early summer 2021.
- Survival declines over time, especially after mid-2021.
- Greater distances (especially 1.5 m, green) generally show faster and steeper declines.
- The 0 m treatment (black) consistently retains the highest survival.
- Dashed “S” aspect lines often decline faster than corresponding solid “N” aspect lines.
Panel-by-panel description
Panel: DF, N
- Black 0 m line remains near 100% through late 2021, then drops to about 35% by 2022 and stabilizes.
- Red 0.25 m line declines moderately to roughly 68%.
- Blue 0.5 m line falls steadily to about 10–25%.
- Green 1.5 m line declines sharply to near 0–2%.
- Dashed lines generally decline faster than solid lines of the same color.
Panel: DF, R
- Black 0 m treatment declines gradually from near 100% to about 25% by the end.
- Red, blue, and green lines all drop rapidly after mid-2021.
- Most non-black treatments reach near 0–10% survival by the final dates.
- Dashed aspect lines reach low survival earlier than solid lines.
Panel: DF, S
- Black 0 m treatment stays above 100% through much of 2021 and ends around 70%.
- Red 0.25 m treatment declines gradually to around 10–15%.
- Blue and green treatments fall steeply to near 0%.
- Dashed lines again decline earlier and more sharply than solid lines.
Panel: PP, N
- This panel shows the highest overall survival.
- Most solid lines remain between about 70% and 100% throughout the study.
- Dashed lines decline somewhat more, especially red and blue, but remain above roughly 55%.
- Green solid line decreases moderately to about 78%.
Panel: PP, R
- Black and red solid lines remain relatively high, ending near 78%.
- Blue and green solid lines decline to approximately 45–55%.
- Dashed lines show stronger declines:
- Red dashed line drops to about 33%.
- Green dashed line ends near 45%.
Panel: PP, S
- Black 0 m treatment remains highest, ending near 90%.
- Red 0.25 m treatment declines moderately to around 67%.
- Blue and green treatments show substantial declines.
- Dashed blue line drops rapidly to about 10%.
- Dashed green line declines steadily to near 10–12%.
Key interpretation
The figure demonstrates that survival generally decreases over time and is strongly influenced by distance treatment. Organisms or samples closest to the reference point (0 m) consistently maintain the highest survival, while greater distances—especially 1.5 m—experience the lowest survival. Differences between the two DWD aspects are also evident, with dashed “S” aspect lines frequently showing faster declines than solid “N” aspect lines.
- Deliberately orient DWD east–west (or southeast to northwest), possibly during timber harvest.
- Plant conifer seedlings on the north side of the DWD and within 0.25 m (0.82 ft). On the south side and at farther distances, the microsite benefit is weak and may not provide favorable growing conditions.
- Forest landowners concerned about hot, dry sites can ask loggers to leave “cull” logs (logs with little to no market value) scattered throughout the harvest unit to create better planting microsites.
- Retain DWD segments at least 12 inches in diameter to create microsites. Further research is needed to better assess how the microsite zone varies with DWD size.
- Prioritize microsites on south-facing slopes and in drought prone areas, as the benefit of microsites is reduced on north-facing slopes and other areas where heat or drought stress is less (such as riparian areas or at higher elevations).
Extra Considerations
- If you plan to use prescribed fire on your site within 15–20 years, then planting close to DWD may not be advisable. If the DWD has experienced significant decay, it may burn slowly via glowing combustion, injuring or killing nearby young trees.
Acknowledgements
This research was funded by the Emerging Research Issues in Agriculture program within the College of Agricultural, Human, and Natural Resource Sciences (CAHNRS) at Washington State University (#PG00019576). The WSU Forestry Club assisted in cutting, processing, and transporting logs to the research site within the E.H. Steffen Center. The Pitkin Forest Nursery of the College of Natural Resources at the University of Idaho provided the DF and PP seedling stock.
References
Heinemann, K., and T. Kitzberger. 2006. Effects of Position, Understorey Vegetation and Coarse Woody Debris on Tree Regeneration in Two Environmentally Contrasting Forests of North‐Western Patagonia: A Manipulative Approach. Journal of Biogeography 33(8): 1357–1367.
Swanson, M.E., M.I. Magee, A.S. Nelson, R. Engstrom, and H.D. Adams. 2023. Experimental Downed Woody Debris-Created Microsites Enhance Tree Survival and Growth in Extreme Summer Heat. Frontiers in Forests and Global Change 6: 1224624.
White, R.H., S. Anderson, J.F. Booth, et al. 2023. The Unprecedented Pacific Northwest Heatwave of June 2021. Nature Communications 14: 727.
By
Mark E. Swanson, Starker Chair in Private and Family Forestry, College of Forestry, Department of Forest Engineering, Resources, and Management, Oregon State University (Formerly Washington State University)
Margaret I. Magee, PhD Student, College of Forestry, Department of Forest Engineering, Resources, and Management, Oregon State University (Formerly Washington State University)

TB112E

Copyright © Washington State University
WSU Extension publications contain material written and produced for public distribution. Alternative text descriptions for select complex images were generated using ChatGPT (OpenAI), then reviewed and adapted to ensure compliance with Web Content Accessibility Guidelines (WCAG) accessibility standards.
Issued by Washington State University Extension and the US Department of Agriculture in furtherance of the Acts of May 8 and June 30, 1914. Extension programs and policies are consistent with federal and state laws and regulations on nondiscrimination regarding race, sex, religion, age, color, creed, and national or ethnic origin; physical, mental, or sensory disability; marital status or sexual orientation; and status as a Vietnam-era or disabled veteran. Evidence of noncompliance may be reported through your local WSU Extension office. Trade names have been used to simplify information; no endorsement is intended.