Beat the Heat: Protecting Northern Highbush Blueberry from Extreme Heat
Description
Heat stress and high temperatures reduce pollination, limit fruit development, and can damage developing and ripened berries. Learn how to manage the effects of extreme heat to help protect your next crop.
Abstract
Blueberry production is increasingly threatened by extreme heat events in the Pacific Northwest. High temperatures during flowering reduce pollination and limit fruit development through direct damage to critical parts of the flower. Developing and ripe berries can also be directly damaged by extreme heat. The purpose of this publication is to describe both the conditions under which extreme heat can damage blueberry flowers and fruits and the likelihood of high temperatures occurring during critical developmental periods within Washington State. Spatial analogs of future heat stress and strategies to mitigate the negative effects of extreme heat are also reviewed. Information regarding future risks and mitigation measures will help the blueberry industry to protect their crop from the negative effects of extreme heat.
Introduction
Northern highbush blueberry (Vaccinium corymbosum; hereafter “blueberry”) is a type of high chill blueberry of significant economic importance in Washington and the greater Pacific Northwest. Washington leads the country in production of blueberries and annually contributes approximately 21%–26% of the total crop to the national supply (USDA NASS 2024). Production is largely divided between two distinct growing regions located on the east and west sides of the Cascade Range. On the east side, which includes Adams, Grant, Benton, Walla Walla, and Yakima Counties, most blueberries are grown organically and sold fresh, while on the west side, which includes Skagit, Snohomish, and Whatcom Counties, most blueberries are grown conventionally and either frozen or processed into juice and other products. Washington blueberries are marketed both nationally and internationally and are vital to the state’s economy.
The blueberry industry has become increasingly threatened by extreme heat. Extreme heat events, often referred to as “heat waves,” occur when there are periods of high air temperatures for a sequence of several days (WMO 2025). The Pacific Northwest experienced a historic heat event in 2021, when a heat dome settled over the region in late June. Temperatures exceeded 110°F throughout the region during this time, resulting in significant damage to numerous crops, including blueberries. Since high temperatures often occur in eastern Washington, most blueberry growers already had overhead sprinklers in place for evaporative cooling and, consequently, had much less heat damage in their fruit than those located in western Washington. To inform investment in technology and practices for mitigating heat damage, western Washington growers would benefit from science-based information on future risks of extreme heat events within their production area.
The purpose of this publication is to describe both the conditions under which extreme heat events can damage blueberry flowers and fruits and the likelihood of extreme heat events to occur during critical crop developmental periods within Washington State. Spatial analogs of future heat stress and strategies to mitigate the negative effects of extreme heat are also reviewed.
Impacts of Heat on Blueberry Flowers and Fruits
Plants, including blueberries, have temperature thresholds for optimum growth and functioning. Important metabolic processes critical for growth and fruit development can be interrupted when these thresholds are exceeded. Photosynthesis is one of the most vital physiological processes in plants, as it generates energy converted from light that drives other essential metabolic processes. Research on optimum conditions for blueberry photosynthesis indicates there are differences by cultivar, but on average, the optimum air temperature range for leaves is 68°F–77°F (Vander Weide et al., forthcoming [2025]). Photosynthesis declines beyond these ranges, which can result in reduced growth, lower yields, and poorer fruit quality.
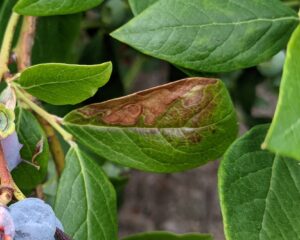
Elevated temperatures can also directly damage plant tissues. The likelihood of direct damage is greater when high temperatures are combined with elevated UV levels, low relative humidity, and hot, desiccating winds. For example, leaves may become wilted or scorched. Wilting is the result of leaves being unable to maintain hydration status. Scorching similarly is related to poor hydration status in leaves and high leaf temperatures, leading to damaged leaves that turn brown, yellow, or black (Figure 1). Wilting and scorching can occur even when ample amounts of water are provided to the root zone. This is because heat stress can cause plants to close their stomata (i.e., tiny “pores” on plant surfaces), which limits the plant’s ability to take up water from the root zone. Closed stomata also limit gas exchange for photosynthesis and evaporative cooling. The inability to evaporatively cool causes leaf temperatures to further rise and exacerbates damage.
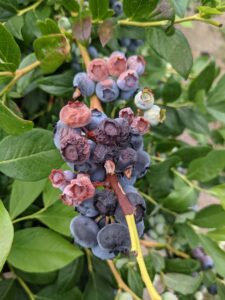
Blueberry fruit can be damaged when air temperatures exceed certain thresholds. When high temperatures coincide with fruit development, water and carbohydrates are diverted from the fruit to supply leaves and other vegetative components of the plant, promoting survival but resulting in a reduction in fruit quality and storability (Yang et al. 2019). Blue fruit start showing signs of necrosis, spotting, shriveling or wrinkling, and poor coloration at 95°F and higher (Figure 2). Green fruit begins exhibiting the same symptoms at a lower threshold of 90°F (Yang et al. 2019). Transpiration can cool the fruit; however, transpiration has biological limits due to fruit possessing few stomata and the presence of wax that naturally thickens and covers stomata as fruit develops (Yang et al. 2020b). Therefore, at these high temperatures, additional cooling methods are required to prevent reductions in yield or fruit quality.
Additionally, blueberry flower functioning and viability are inhibited above certain temperatures, interfering with pollination and fertilization. Once viable pollen has landed on the receptive female surface of a flower (i.e., the stigma), it germinates and produces a pollen tube that ultimately contributes to fertilization and fruit development. Research has shown pollen germination decreases when temperatures exceed 86°F, and pollen tube growth is inhibited starting at 95°F (Walters and Isaacs 2023). Moreover, pollen exposed to 100°F for only four hours results in substantial and irreversible reductions in pollen germination and pollen tube growth. Extreme heat events can also cause the ovules, which ultimately give rise to the seeds following successful fertilization, to age more rapidly (Isaacs et al. 2020). Rapid ovule aging reduces the effective pollination period and chances of successful pollination and fertilization. Heat stress during flower development and bloom has also been shown to interfere with the development of other floral structures in the plant and restrict stigma receptivity and pollen capture across multiple plant species (Wang et al. 2021). Overall, damage to flowers that results in reduced pollination and fertilization ultimately leads to downstream impacts on yield.
Beyond plants, extreme heat can impact insect pollinators both directly and indirectly (Walters et al. 2022). Extreme heat events leading up to bloom can disrupt the emergence of wild pollinators and lead to phenological mismatch, which occurs when the bloom time no longer overlaps with the emergence and activity of pollinating species. This can result in reduced pollination and crop yield, particularly in systems that depend more on the pollination services of wild pollinators. Extreme heat can also impact the production and nutritional composition of floral rewards, such as nectar and pollen. Mason bees (Osmia lignaria) that consumed pollen collected from plants exposed to extreme heat (99.5°F) during bloom laid fewer eggs, and the resulting larvae had lower survival and delayed emergence, than those that were fed untreated pollen (Walters et al. 2024a). Over time, this reduction in insect reproduction could further contribute to the decline in insect populations that provide critical pollination services. Although speculative, managed honey bees (Apis mellifera) that feed on less nutritious nectar and pollen may also produce larvae with lower survival rates, leading to smaller colonies and possibly increased colony mortality and higher beekeeper costs. Exposure to warmer temperatures in the fall season can also skew overwintering honey bee populations to more physiologically aged bees, due to additional foraging, and make the overwintering colony more susceptible to collapse the following spring (Rajagopalan et al. 2024).
Historical and Future Prospects for Extreme Heat
To estimate historical and future prospects of extreme heat, we focused on two metrics based on the damage-inducing air temperature thresholds noted in the previous section. These metrics included (a) the frequency of heat stress exposure, expressed as the number of years in which heat stress can be expected over a span of 10 years, and (b) the magnitude of heat stress, expressed as the number of days with heat stress per year averaged across all years with some heat stress exposure. For future projections of heat stress, we focus on the immediate future time frame (2025–2055) and report average values across 17 climate models. While there can be multiple greenhouse gas emissions scenarios associated with different levels of warming, these scenarios start to diverge from each other post mid-century only. Therefore, given our focus on a pre-mid-century time frame, we report projected future changes in heat stress for only one of the emissions scenarios, as the key message will be similar across each of the scenarios. The specific emission scenario selected was the Representative Concentration Pathway (RCP) of 8.5, which is a “high emissions” scenario where emissions and therefore resulting greenhouse gas concentrations in the atmosphere continue to increase until the end of the century. Due to the “greenhouse” effect, this means additional energy is trapped in the earth system, leading to warming. The value of 8.5 signifies an additional energy of 8.5 watts per square meter across the earth at the end of the century as compared to preindustrial times. As the scenario with the highest additional energy assumption, RCP 8.5 will result in relatively higher warming than other scenarios, with differences across scenarios becoming prominent post mid-century.
Results are reported separately for all blueberry production counties in Washington State, with counties based on review of the Washington State Department of Agriculture’s 2022 Agricultural Land Use Database. Historical temperature data (from 1979 to 2019) for the blueberry production regions were obtained from the gridMET dataset (Abatzoglou 2013), and future climate projections were based on Abatzoglou and Brown (2012). Results are presented for the bloom and post bloom time frames separately. The bloom period was determined using a phenology model being developed for integration with the WSU Decision Aid System (https://decisionaid.systems/). Post bloom encompasses fruit development and harvest.
Historical Risks of Heat Stress Exposure
Bloom Period
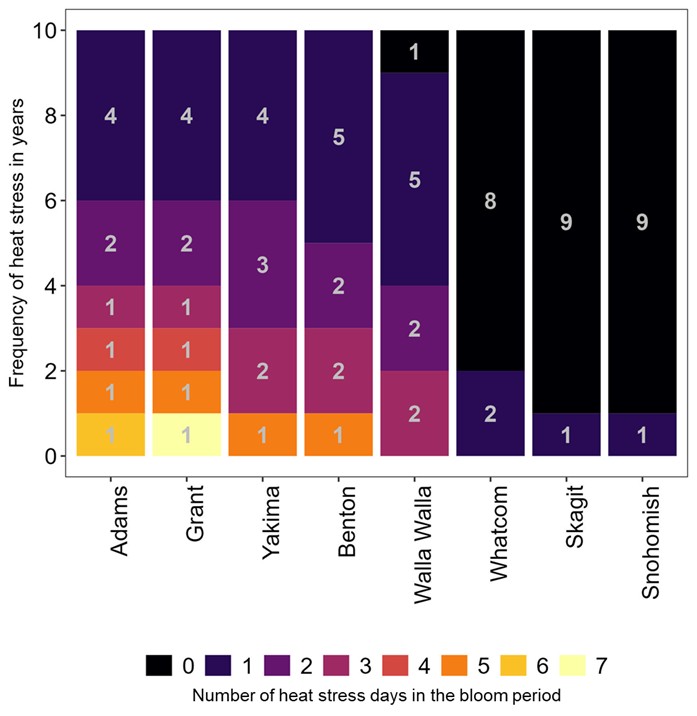
As expected, we predict there will be lower frequency and magnitude of heat stress exposure on the west side of the state than on the east side, with Adams and Grant Counties experiencing the highest levels of heat stress (Figure 3).
Post Bloom Period
The differences between east- and westside are also demonstrated in the post bloom period, with heat stress more frequent in counties east of the Cascade Range (Figure 4). Not surprisingly, in both regions, the maximum risk of heat stress exposure is in July and August.

Expected Changes in Heat Stress in the Next 30 Years
Bloom Period
There are minimal expected changes in both the frequency and magnitude of heat stress exposure during the bloom period across Washington State. The reason for minimal change, despite warming, is the shift in bloom timing to earlier in the season under future warming scenarios. However, this shift in bloom could result in a phenological mismatch between blueberry flowering and wild insect pollinator emergence and activity. Early bloom times may also interfere with the cost and accessibility of honey bee colonies, particularly if there is overlap with other blooming horticultural crops that depend on honey bees for pollination.
Post Bloom Period
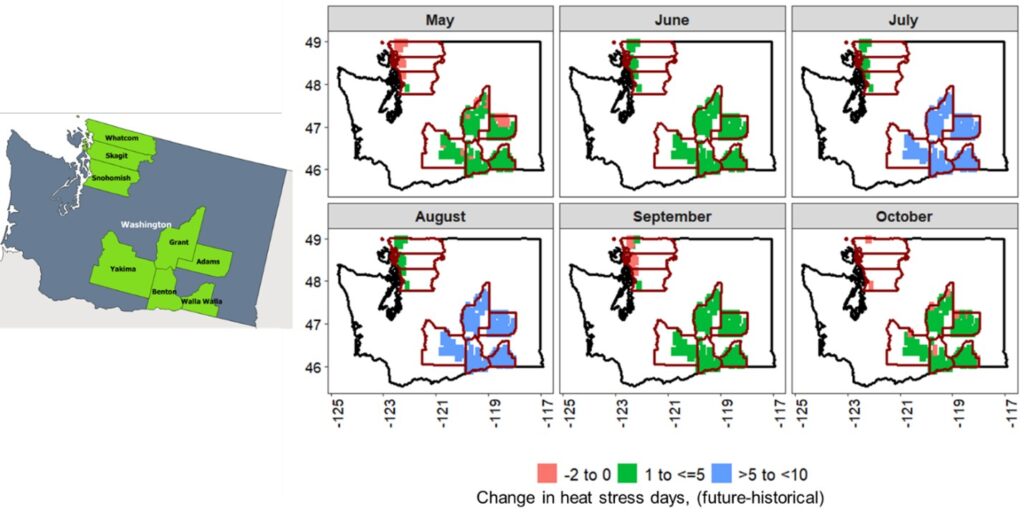
There is an increase in the frequency of heat stress exposure during post bloom across all regions (Table 1). Change in the magnitude of heat stress is minimal in western Washington and greater in eastern Washington, especially in July and August, where 5 to 10 additional days of heat stress conditions can be expected (Figure 5).
Table 1. Historical and estimated future frequency of heat stress exposure for blueberries grown in Washington State. Future projections are for mid-century (i.e., 2040s) and estimated using a high Representative Concentration Pathway (RCP) of 8.5, which is the “high emissions” scenario. The value of 8.5 signifies an additional energy of 8.5 watts per square meter across the earth at the end of the century as compared to preindustrial times, leading to warming of the earth system.| County | Historical mean frequency of heat stress (%) | Historical mean magnitude of heat stress (days) | Future mean (range) frequency of heat stress (%) | Future mean (range) magnitude of heat stress (days) |
|---|---|---|---|---|
| Adams | 71 | 7 | 84 (75–90) | 11 (9–13) |
| Benton | 83 | 8 | 89 (83–95) | 13 (10–14) |
| Grant | 73 | 7 | 86 (78–93) | 12 (9–14) |
| Walla Walla | 79 | 8 | 88 (82–92) | 13 (10–14) |
| Yakima | 84 | 8 | 91 (84–98) | 13 (10–15) |
| Skagit | 2 | 1 | 10 (3–20) | 2 (2–4) |
| Snohomish | 16 | 2 | 12 (3–25) | 2 (2–3) |
| Whatcom | 16 | 1 | 28 (10–41) | 3 (2–4) |
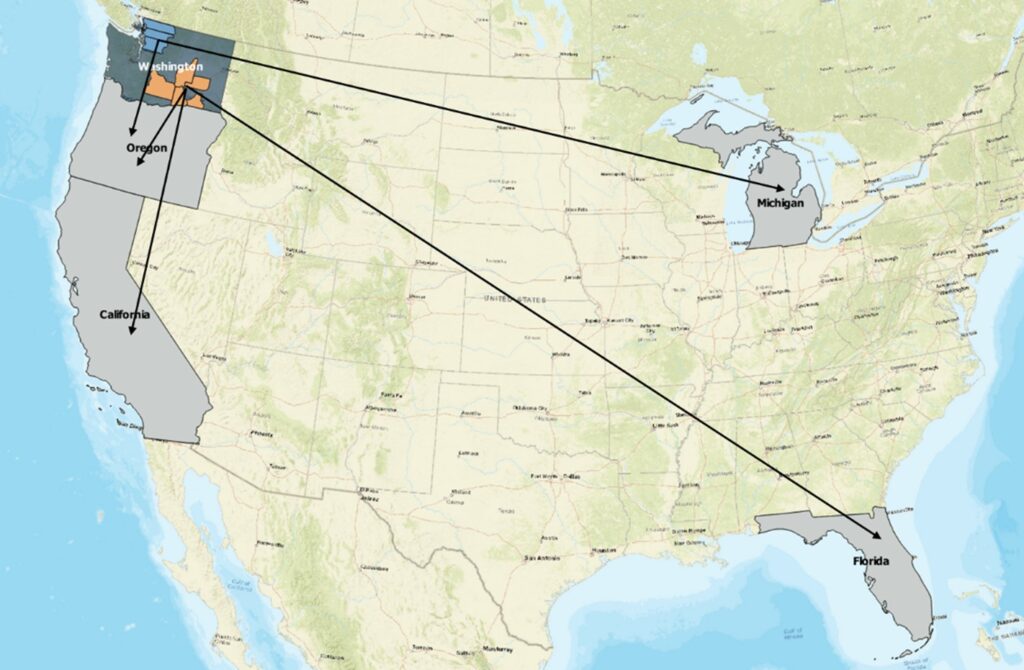
Spatial Analogs of Future Heat Stress
Spatial analogs (Chaudhary et al. 2023) of Washington blueberry production regions are places where current climatic conditions resemble those expected in Washington State in the future. Here, we identify spatial analogs based on just the two frequency and magnitude heat stress metrics discussed above. In general, future heat stress conditions in western Washington resemble current conditions in parts of Oregon and Michigan. For eastern Washington, the analogs are generally in Oregon and California and sometimes in Florida (Figure 6). County-specific information on spatial analogs can be found in Appendix A.
Mitigating Heat Damage
Evaporative Cooling
Evaporative cooling, also known as overhead cooling, is the practice of applying overhead irrigation using sprinklers or microsprinklers during extreme heat. As the water evaporates, the surface of the plant is cooled. A continuous stream of water onto plant surfaces may also aid in cooling, through a process known as convective heat transfer. Microsprinkler-based evaporative cooling systems are widely used in apple orchards and blueberry fields in southeast Washington to prevent heat and sunburn damage. Fogging systems that release microdroplets of water through specialized nozzles may also be used to cool air temperatures and keep plant surfaces cooler than ambient air, but these systems are less studied in blueberry.
Critical to the success of evaporative cooling is determining temperature thresholds for actuating the system to ensure cooling is applied before the threat of damage—but not too early so as to avoid unnecessary water use. The current recommended threshold for protecting developing (green) and ripe (blue) fruit is 90°F and 95°F, respectively (Yang et al. 2019). Cooling systems can be operated continuously until air temperatures are below actuation thresholds, although “pulsing” (i.e., running microsprinklers in cycles of 20 minutes on followed by 40 minutes off) has been effective at protecting blueberries in Oregon and can reduce the incidence of slugs and fruit rot from opportunistic pathogens that prefer moist, humid environments (Yang et al. 2020a). Early research suggests that 85°F–90°F is a good threshold for actuating evaporative cooling systems during bloom (Garcia-Salazar 2023; Walters et al. 2024b). However, additional research is required during the bloom period to understand if evaporative cooling impacts bee activity and overall pollination success. Evaporative cooling may also increase the incidence of disease from pathogens that infect flowers during bloom. Economics is another important consideration, as the infrastructural investments of an evaporative cooling system may not be financially advantageous, especially if the threat of extreme heat is low in a particular climate.
Shade Nets
Farmers have used shade nets (also known as shade cloth) to protect crops from extreme sun exposure for centuries. High ambient temperatures and high light intensities from excessive solar radiation can cause sunburning and plant stress, which shade nets can alleviate. This simple technology works by reducing or modifying incoming solar radiation to plants. Shade nets absorb or reflect the sun’s rays, depending on the material and color. The amount of shade they provide depends on how dense and tightly woven the material is. “Percent shade,” as this value is typically called, can vary from 5% to 95%. For example, a 40% shade cloth blocks 40% of the sun’s rays while letting 60% through. Typically, 30%–50% shade cloth is recommended for protecting plants.
With shade nets, solar radiation intensity can be reduced without affecting the plant’s total daily hours of sun exposure. This provides multiple benefits, including:
- Reduced direct sun exposure: On long, intensely hot days with high solar radiation, shade cloth can reduce symptoms of heat stress and overexposure that can lead to sunburn, wilting, and sunscald.
- Reduced plant water usage: Transpiration is a mechanism plants use to stay cool; by opening their stomata, water in the leaf tissue can evaporate and leave the plant. This process transfers heat from the plant to the environment but causes the plant to lose water. With high sun exposure and air temperatures, the plant will begin to wilt, particularly if water is insufficient in the root zone. By keeping the plant cooler with shade cloth, the plant will not transpire as much and can retain more water for growth and metabolism.
- Greater retention of soil water: Shade cloth can keep the soil cooler. This may increase root growth and reduce the amount of soil water lost from evaporation.
- Protection of plants from other damaging elements: Weather events such as hail, wind, and frost can physically damage plants and reduce yield and fruit quality. The physical structure of a shade net can block hail and wind, depending on the strength of the material and supporting infrastructure, as well as where the netting is placed. In addition, shade netting provides insulation from the outside environment, creating a micro- or meso-climate that can benefit crop growth, depending on the region and time of the year. Some shade netting may even be combined with insect-excluding nets that completely enclose a field, protecting it from insect pests.
Installing shade netting is a practice to consider in environments that reliably experience extreme heat and high light intensities every summer. The farmer pays a significant up-front cost to purchase and install shade netting, but there may be a return on that investment through improved yields and crop quality in subsequent years. Shade netting may be less useful in areas like western Washington, where the prospects of extreme heat are lower.
There are some downsides to consider regarding the use of shade netting:
- Too much shade: While moderate shade levels (40%–60%) may simply delay harvest without affecting fruit quality, too much shade (75% or more) can decrease fruit quality due to reduced total soluble solids (Lobos et al. 2013). Too much shade may also reduce yield and bud development, reducing current and future yields.
- Lower pollinator activity: Another potential downside to shade netting is it may hinder pollinators from pollinating flowers during bloom (Milkovich 2022). Blueberry farmers rely on insect pollinators like honey bees to forage on flowers and consequently provide critical pollination services. However, shade nets can reduce honey bee foraging by disrupting their ability to navigate using sunlight. One approach to working around this problem would be to install shade nets after pollination. Another option is to place honey bee hives outside of the shaded area, but this strategy has drawbacks in larger plantings as honey bees may still be unable to navigate back to their hives.
- Farm activity interference: Shade netting structures may interfere with typical farming activities, such as spraying, machine harvesting, and other tractor work.
- Disease or pest augmentation: The micro- or meso-climate created by shade nets can increase humidity, which in turn can result in an environment more conducive to certain diseases and pests.
An important contributing factor to whether a farmer will implement shade netting is the cost. Beyond buying the material, it needs to be installed and removed by hand, imposing a significant labor cost to the grower. Shade nets also deteriorate over time from rain, wind abrasion, and UV exposure. In Washington, the lifespan of shade nets typically ranges from three to ten years, depending on weather, sunlight intensity, and how well they are maintained. Thus, replacement costs are an important economic consideration when deciding to use shade cloth.
Biostimulants
Interest in biostimulant usage in agriculture has increased in recent years due to the potential benefits they may impart on plant resilience under stressful conditions, including extreme heat events. Biostimulants, also referred to as “priming agents,” are products formulated from humic substances, algae and plant extracts, processed proteins and amino acids, or microorganisms that promote or enhance plant functioning independent of the product’s nutrient content (Du Jardin 2015; Bulgari et al. 2019). In crop production, biostimulants are usually applied to the foliage or soil as supplements along with fertilizers. Biostimulants are an emerging area of research, and more research is required to justify their use. Yet, initial results are promising. One study with juvenile raspberry (Rubus idaeus) demonstrated plants treated with foliar and soil applications of glycine betaine or kelp extract obtained from A. nodosum displayed improved thermotolerance and overall growth relative to untreated plants exposed to heat stress, but the response varied by genotype, underscoring biostimulant effects may be dependent on crop or cultivar genetics (Makonya et al. 2025). Future research in blueberry should be conducted to develop informed recommendations regarding biostimulant use as a tool to mitigate heat damage.
Conclusion
The frequency and magnitude of extreme heat events that can damage developing and ripe blueberry fruits will increase in the future, particularly in eastern Washington. However, future risk of heat damage to flowers is lower due to earlier forecasted bloom times coinciding with cooler springtime temperatures. Heat mitigation strategies, such as evaporative cooling using microsprinklers or the use of shade nets, can be deployed to alleviate heat damage. Successful use of either mitigation technology requires nuanced consideration of production tradeoffs and economic cost benefits. Biostimulants are another promising technology to mitigate heat stress but require further research to inform recommendations.
Acknowledgements
This article was developed by participants in the Climate Analogs Academy, a training program funded by the USDA NIFA Extension Climate Hub Partnerships Project (award number 2023-67013-39348). The Academy is hosted by Washington State University’s Center for Sustaining Agriculture and Natural Resources, supported by the Pacific Northwest USDA Climate Hub and Washington State University. We would also like to acknowledge funding from the Northwest Center for Small Fruits Research and the USDA NIFA Specialty Crop Research Initiative project (award number 2020-51181-32155) that developed the blueberry flowering phenology model.
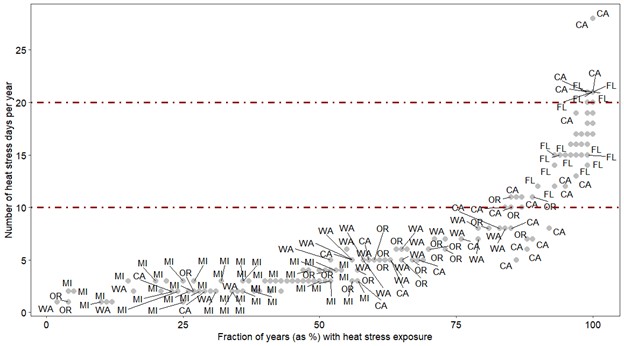
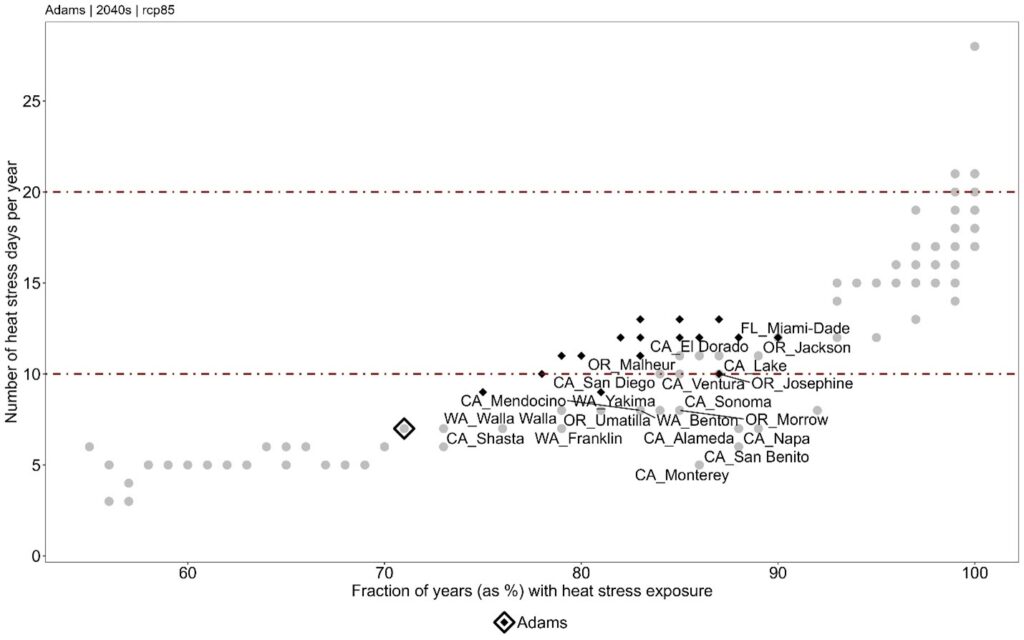
Appendix A
This section has visualizations of spatial analogs for each blueberry producing county in Washington State. The historical frequency and magnitude heat stress exposure metrics for all blueberry producing counties in Washington State and all crop producing counties in the other major blueberry producing states (Oregon, California, Michigan, and Florida) indicates the large spatial variables (Figure 1A). Figures 2A through 9A zoom in on each blueberry producing county in Washington and show historical heat stress (diamond, bold dot), future heat stress (17 bold dots corresponding to 17 climate models), and the spatial analog counties with historical heat stress metrics similar to the Washington county’s future heat stress.


References
Abatzoglou, J.T. 2013. Development of Gridded Surface Meteorological Data for Ecological Applications and Modelling. International Journal of Climatology 33(1): 121–131.
Abatzoglou, J.T., and T.J. Brown. 2012. A Comparison of Statistical Downscaling Methods Suited for Wildfire Applications. International Journal of Climatology 32(5): 772–780.
Bulgari, R., G. Franzoni, and A. Ferrante. 2019. Biostimulants Application in Horticultural Crops Under Abiotic Stress Conditions. Agronomy 9(6): 306.
Chaudhary, S., K. Rajagopalan, C.E. Kruger, et al. 2023. Climate Analogs Can Catalyze Cross-Regional Dialogs for US Specialty Crop Adaptation. Scientific Reports 13(1): 9317.
Du Jardin, P. 2015. Plant Biostimulants: Definition, Concept, Main Categories and Regulation. Scientia Horticulturae 196: 3–14.
Garcia-Salazar, C. 2023. Protecting Blueberry Blooms from Extreme Heat Injury Using Overhead Irrigation. Michigan State University Extension.
Isaacs, R., J. Walters, and M. Longstroth. 2020. Hot Weather Causing Rapid Blueberry Bloom. Michigan State University Extension.
Lobos, G.A., J.B. Retamales, J.F. Hancock, J.A. Flore, S. Romero-Bravo, and A. Del Pozo. 2013. Productivity and Fruit Quality of Vaccinium corymbosum cv. Elliott Under Photo-Selective Shading Nets. Scientia Horticulturae 153: 143–149.
Makonya, G.M., D.R. Bryla, M.A. Hardigan, W. Hoashi-Erhardt, and L.W DeVetter. 2025. Biostimulants with Glycine Betaine or Kelp Extract Alleviate Heat Stress in Red Raspberry (Rubus idaeus). Scientific Reports 15(1): 2251.
Milkovich, M. 2022. Blocking Bees by Netting Trees. Good Fruit Grower.
Rajagopalan, K., G. DeGrandi-Hoffman, M. Pruett, et al. 2024. Warmer Autumns and Winters Could Reduce Honey Bee Overwintering Survival with Potential Risks for Pollination Services. Scientific Reports 14(1): 5410.
USDA NASS (United States Department of Agriculture National Agricultural Statistics Service). 2024. Noncitrus Fruits and Nuts 2023 Summary.
Vander Weide, et al. Forthcoming (2025). Acta Horticulturae.
Walters, J., M. Barlass, R. Fisher, and R. Isaacs. 2024a. Extreme Heat Exposure of Host Plants Indirectly Reduces Solitary Bee Fecundity and Survival. Proceedings of the Royal Society B 291: 20240714.
Walters, J., and R. Isaacs. 2023. Pollen Germination and Tube Growth in Northern Highbush Blueberry Are Inhibited by Extreme Heat. HortScience 58: 635–642.
Walters, J., S. Van Timmerman, and R. Isaacs. 2024b. Protecting Blueberry Bloom from Extreme Heat Using Overhead Irrigation. Michigan State University Extension.
Walters, J., J. Zavalnitskaya, R. Isaacs, and Z. Szendrei. 2022. Heat of the Moment: Extreme Heat Poses a Risk to Bee–Plant Interactions and Crop Yields. Current Opinion in Insect Science 52: 100927.
Wang, Y., S.M. Impa, R. Sunkar, and S.V.K. Jagadish. 2021. The Neglected Other Half—Role of the Pistil in Plant Heat Stress Responses. Plant, Cell & Environment 44: 2200–2210.
WMO (World Meteorological Organization). 2025. Heatwave.
Yang, F.H., D.R. Bryla, and B.C. Strik. 2019. Critical Temperatures and Heating Times for Fruit Damage in Northern Highbush Blueberry. HortScience 54: 2231–2239.
Yang, F.H., D.R. Bryla, S.T. Orr, B.C. Strik, and Y. Zhao. 2020a. Thermal Cooling with Sprinklers or Microsprinklers Reduces Heat Damage and Improves Fruit Quality in Northern Highbush Blueberry. HortScience 55: 1365–1371.
Yang, F.H., L.W. DeVetter, B.C. Strik, and D.R. Bryla. 2020b. Stomatal Functioning and Its Influence on Fruit Calcium Accumulation in Northern Highbush Blueberry. HortScience 55: 96–102.
Lisa Wasko DeVetter, Professor, Department of Horticulture, Washington State University
Supriya Savalkar, Former Graduate Student, Biological Systems Engineering, Washington State University
Bhupinderjeet Singh, Graduate Student, Biological Systems Engineering, Washington State University
Micah Evalt, Graduate Student, Department of Horticulture, Washington State University
Pedro Rojas-Barros, Postdoctoral Researcher, Department of Horticulture, Washington State University
David R. Bryla, Research Horticulturist, USDA-ARS
Kirti Rajagopalan, Assistant Professor, Biological Systems Engineering, Washington State University

FS406E

Copyright © Washington State University
WSU Extension publications contain material written and produced for public distribution. Alternative text descriptions for select complex images were generated using ChatGPT (OpenAI), then reviewed and adapted to ensure compliance with Web Content Accessibility Guidelines (WCAG) accessibility standards.
Issued by Washington State University Extension and the US Department of Agriculture in furtherance of the Acts of May 8 and June 30, 1914. Extension programs and policies are consistent with federal and state laws and regulations on nondiscrimination regarding race, sex, religion, age, color, creed, and national or ethnic origin; physical, mental, or sensory disability; marital status or sexual orientation; and status as a Vietnam-era or disabled veteran. Evidence of noncompliance may be reported through your local WSU Extension office. Trade names have been used to simplify information; no endorsement is intended.