WSU Wilke Research and Extension Farm Operation, Production, and Economic Performance for 2024
Description
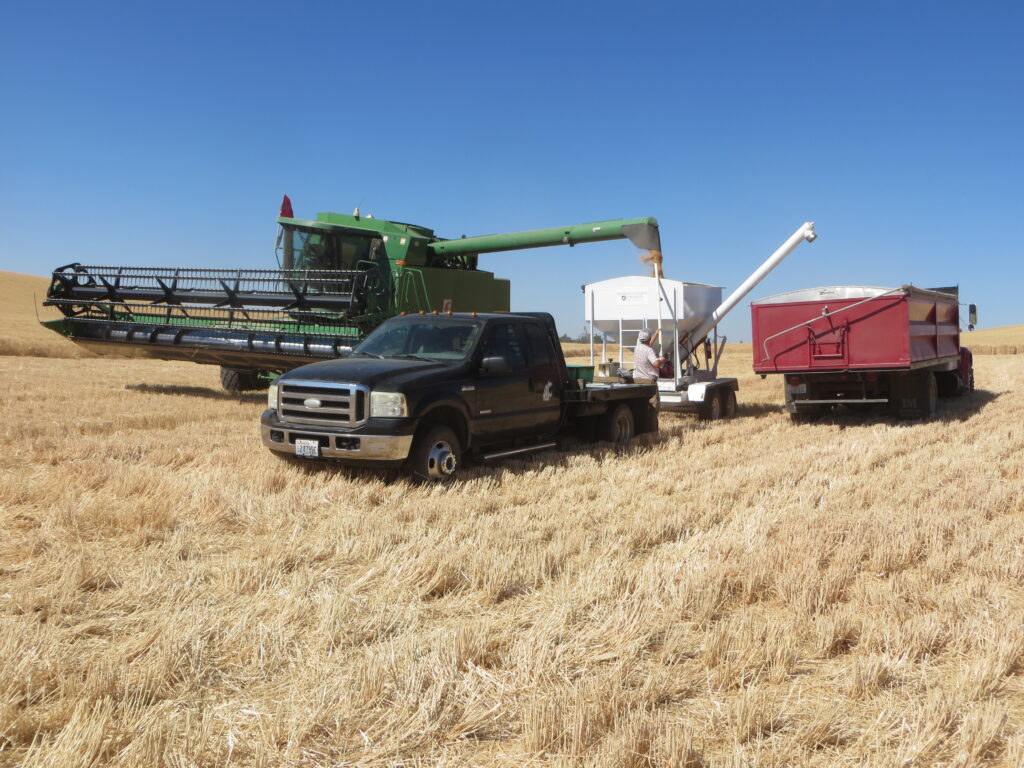
This annual publication explores the cropping systems, field operations, and economic performance at the WSU Wilke Research and Extension Farm. Produced with farmers, crop consultants, and researchers in mind, production data and insights to support on-farm decision-making for the intermediate rainfall zone are provided.
3-Year Crop Rotation
Field 2: Split Between Winter Wheat (64%) and Winter Canola (36%)
- Variety and Crop: ‘LCS Kraken AX’ soft white winter wheat seeded into fallow.
- Seed Date and Rate: September 11, 2023, at a seeding rate of 75 lb/acre (23 seeds/ft2).
- Starter Fertilizer: 6.5 gpa liquid blend (9-15-0.3-1 plus 0.11 lb/ac Zn and 0.08 lb/ac B).
- Deep Fertilizer: average 60-0-0-5 using a 90% Sol 32 and 10% thio-sul.
- 28% received 76-0-0-7 or more.
- 58% received 56-0-0-5 or less.
- 14% received rates between these values.
- In-Crop Herbicide: 12 fl oz/acre of Aggressor AX with 1 gallon/100 gallons MSO applied at 20 gpa on April 12, 2024.
- In-Crop Herbicide: 13.5 fluid oz/acre Huskie, 2 qt/100 gallons Full Load Complete, 32 fluid oz/acre molasses, and 3 gpa Tracite Stand Xtra fertilizer (4-0-0.6-0 plus 0.6 percent calcium, 0.5 percent magnesium, and 3.4 percent chloride) applied at 10 gpa on April 17, 2024.
- Postharvest Herbicide: 12% of the field was sprayed with the WEEDit, applying 4 fl oz/acre Gramoxone SL 3.0, 0.8 fl oz/acre NIS, and 1.6 fl oz/acre COC in 20 gpa of carrier on September 3, 2024.
- Variety and Crop: ‘Plurax’ winter canola into fallow.
- Seed Data and Rate: August 14 through September 1, 2023, at a seeding rate of 4.7 lb/acre (6.7 seed/ft2).
- Starter Fertilizer: 3.5 gpa liquid blend of 10-34-0 and humic.
- Deep Fertilizer: 66-0-0-6 using a 90% Sol 32 and 10% thio-sul.
- In-Crop Herbicide: 12 fl oz/acre Assure II, and 13 fl oz/acre crop oil applied at 10 gpa on April 11, 2024.
- Insecticide: 3.4 fl oz/acre Lambda-CY, 3 fl oz/acre Preference, 5.5 fl oz/acre Interlock, and 11 fl oz/acre Max-in B applied at 3 gpa. Aerial applied on May 21, 2024, to control cabbage seed pod weevil.
- Postharvest Herbicide: 63% of the field was sprayed with the WEEDit, applying 20 fl oz/acre Gramoxone SL 3.0, 0.8 fl oz/acre NIS, and 1.6 fl oz/acre COC in 20 gpa of carrier on September 3, 2024.
Field 4: Spring Cereal
- Variety and Crop: ‘Ryan’ soft white spring wheat.
- Seed Date and Rate: April 11, 2024, at 86 lb/acre (25 seeds/ft2).
- Starter Fertilizer: 5.0 gpa liquid blend (7-11-0.4-1 plus 0.04 lb/acre Zn and 0.06 lb/acre B).
- Deep Fertilizer: Average 44-0-0-5 using a 90% Sol 32 and 10% thio-sul.
- 20% received 80-0-0-7 or more.
- 14% received 33-0-0-3 or less.
- 66% received rates between these values.
- Preplant Herbicide: 0.3 oz/acre Vesuvius at 10 gpa on March 27, 2024.
- Preplant Herbicide: 32 fl oz/acre RT3, 1 qt/100 Full Load Complete at 10 gpa on March 29, 2024.
- In-Crop Herbicide: 18 fl oz/acre MCPA ester, 0.75 oz/acre Quelex, 0.75 qt/100 NIS, and 3 gpa Rally fertilizer (3-0-1.1-0 plus 0.1 Mg, and 1.1 Cl) at 10 gpa on May 31, 2024.
- Postharvest Herbicide: 6.9% of field was sprayed with the WEEDit, applying 2.2 fl oz/acre Gramoxone SL 3.0, 0.4 fl oz/acre NIS and 0.7 fl oz/acre COC @ 20 gpa on September 3, 2024.
Field 7: No-Till Fallow
- Variety and Crop: No-till fallow.
- Herbicide: 12 fl oz/acre Dimetric EXT, 12 fl oz/acre RT3, and 1 qt/100 gallons Full Load Complete was applied at 10 gpa on November 8, 2023.
- Herbicide: Sprayed with WEEDit in dual mode and 8.9 fl oz/acre RT3 and 0.84 lb/acre AMS applied at 12 gpa on May 9, 2024.
- Herbicide: 25% of the field was sprayed with the WEEDit, applying 8 fl oz/acre RT3, 1 fl oz/acre Full Load Complete, and 8 fl oz/acre molasses at 12 gpa on June 21, 2024.
- Herbicide: 47% of the field was sprayed with the WEEDit, applying 15 fl oz/acre RT3, 0.9 fl oz/acre Sharpen,15 fl oz/acre molasses 0.7 lb/acre AMS, and 8.9 fl oz/acre MSO at 15 gpa on July 11, 2024.
- Herbicide: 9% of the field was sprayed with the WEEDit, applying 3.8 fl oz/acre RT3, 0.13 fl oz/acre Sharpen, 2.8 fl oz/acre molasses 0.13 lb/acre AMS, and 0.4 fl oz/acre Full Load Complete at 15 gpa on July 30, 2024.
- Herbicide: 4 5% of field was sprayed with the WEEDit, applying 1.7 fl oz/acre Gramoxone SL 3.0, 0.3 fl oz/acre NIS, and 0.7 fl oz/acre COC at 20 gpa on September 3, 2024.
4-Year Crop Rotation
Field 1: No-Till Fallow
- Variety and Crop: No-till fallow.
- Herbicide: 12 fl oz/acre Dimetric EXT, 12 fl oz/acre RT3, and 1 qt/100 gallons Full Load Complete was applied at 10 gpa on November 8, 2023.
- Herbicide: Sprayed with WEEDit in dual mode and 8.9 fl oz/acre RT3 and 0.84 lb/acre AMS was applied at 12 gpa on May 9, 2024.
- Herbicide: 36% of the field was sprayed with the WEEDit, applying 11.4 fl oz/acre RT3, 1.4 fl oz/acre Full Load Complete, and 8 fl oz/acre molasses at 12 gpa on June 21, 2024.
- Herbicide: 44% of the field was sprayed with the WEEDit, applying 14 fl oz/acre RT3, 0.9 fl oz/acre Sharpen, 14 fl oz/acre molasses 0.7 lb/acre AMS, and 8.6 fl oz/acre MSO at 15 gpa on July 12, 2024.
- Herbicide: 15% of the field was sprayed with the WEEDit, applying 6.5 fl oz/acre RT3, 0.2 fl oz/acre Sharpen, 4.8 fl oz/acre molasses, 0.2 lb/acre AMS, and 0.7 fl oz/acre Full Load Complete at 15 gpa on July 30, 2024.
- Herbicide: 6% of field was sprayed with the WEEDit, applying 1.8 fl oz/acre Gramoxone SL 3.0, 0.4 fl oz/acre NIS, and 0.7 fl oz/acre COC at 20 gpa on September 3, 2024.
Field 3: Fallow Winter Wheat
- Variety and Crop: ‘Sockeye CL+’ soft white winter wheat seeded into fallow.
- Seed Date and Rate: September 13, 2023, at a seeding rate of 88 lb/acre (23 seeds/ft2).
- Starter Fertilizer: 6.5 gpa liquid blend (9-15-0.3-1 plus 0.11 lb/acre Zn and 0.08 lb/acre B).
- Deep Fertilizer: Average 77-0-0-7 using a 90% Sol 32 and 10% thio-sul.
- 28% received 90-0-0-9 or more.
- 32% received 63-0-0-5 or less.
- 40% received rates between these values.
- Top-Dress Fertilizer: 6.7 gpa Sol 32 (24-0-0-0) and 86 fl oz/acre of molasses at 10 gpa on March 22, 2024.
- In-Crop Herbicide: 4.75 oz/acre Osprey Xtra, 13.5 fl oz/acre Huskie, 2 qt/100 gallons Full Load Complete, 32 fl oz/acre molasses, and 3 gpa Tracite Stand Xtra fertilizer (4-0-0.6-0 plus 0.6 percent calcium, 0.5 percent magnesium, and 3.4 percent chloride), applied at 15 gpa on April 23, 2024.
Field 4: Continuous Winter Wheat
- Variety and Crop: ‘Sockeye CL+’ soft white winter wheat.
- Seed Date and Rate: October 4, 2023, at a seeding rate of 88 lb/acre (23 seeds/ft2).
- Starter Fertilizer: 6.5 gpa liquid blend (9-15-0.3-1 plus 0.11 lb/acre Zn and 0.08 lb/acre B).
- Deep Fertilizer: average 63-0-0-5 using a 90% Sol 32 and 10% thio-sul.
- 25% received 66-0-0-6 or more.
- 13% received 60-0-0-5 or less.
- 63% received rates between these values.
- Postplant, Preemergent Herbicide: 3 fl oz/acre Anthem Flex, 16 fl oz/acre RT3, and 1 qt/100 Full Load Complete @ 10 gpa on October 9, 2023.
- In-Crop Herbicide: 14 fl oz/acre WideARMatch, 32 fl oz/acre molasses, and 3 gpa Tracite Stand Xtra fertilizer (4-0-0.6-0 plus 0.6 Ca, 0.5 Mg, and 3.4 Cl) at 10 gpa on April 23, 2024.
- In-Crop Herbicide: 5 fl oz/acre Beyond, 10 lb/100 AMS, and 1 qt/100 MSO at 15 gpa on May 3, 2024.
Field 6: Broadleaf
- Variety and Crop: ‘IdaGold’ yellow mustard.
- Seed Date and Rate: April 12, 2024. 8 lb/acre and May 3, 2024. 9 lb/acre. Severe frost damage caused replanting.
- Starter Fertilizer: 5 gpa liquid starter blend (7-11-0.4-1 plus 0.04 Zn and 0.06 B).
- Deep Fertilizer: average 32-0-0-3 using a 90% Sol 32 and 10% thio-sul.
- 24% received 40-0-0-3 or more.
- 18% received 20-0-0-2 or less.
- 58% received rates between these values.
- Preplant Herbicide: 32 fl oz/acre RT3, and 1 qt/100 NIS at 10 gpa on March 29, 2024.
- In-Crop Herbicide: 5-31-24: 5 fl oz/acre Section 2EC, 12 lb/acre AMS, 1gal/100 COC at 12 gpa on May 31, 2024.
- Section 2EC is no longer registered in Washington State but was labeled at the time of purchase and was applied as specified by the label on the container.
- Postharvest Herbicide: 34% of field was sprayed with the WEEDit, applying 11 fl oz/acre Gramoxone SL 3.0, 2.2 fl oz/acre NIS, and 4.4 fl oz/acre COC at 20 gpa on September 3, 2024.
Continuous Crop Rotation
Field 8: Continuous Winter Wheat
- Variety and Crop: ‘Castella’ soft white winter club wheat.
- Seed Date and Rate: October 4, 2023, at a seeding rate of 77 lb/acre (23 seeds/ft2).
- Starter Fertilizer: 6.5 gpa liquid blend (9-15-0.3-1 plus 0.11 lb/acre Zn and 0.08 lb/acre B).
- Deep Fertilizer: Average 66-0-0-6 using a 90% Sol 32 and 10% thio-sul.
- 15% received 76-0-0-7 or more.
- 21% received 60-0-0-5 or less.
- 64% received rates between these values.
- Postplant, Preemergent Herbicide: 3 fl oz/acre Anthem Flex, 16 fl oz/acre RT3, and 1 qt/100 Full Load Complete at 10 gpa on October 9, 2023.
- In-Crop Herbicide: 14 fl oz/acre WideARMatch, 32 fl oz/acre molasses, and 3 gpa Tracite Stand Xtra fertilizer (4-0-0.6-0 plus 0.6 Ca, 0.5 Mg, and 3.4 Cl) at 10 gpa on April 23, 2024.
Field 9: Broadleaf
- Variety and Crop: ‘Invigor L345P’ spring canola.
- Seed Date and Rate: April 23, 2024, 5 lb/acre (9 seeds/ft2), and May 10, 2024, 5 lb/acre (9 seeds/ft2). Severe frost damage caused replanting.
- Starter Fertilizer: 5 gpa liquid starter blend (7-11-0.4-1 plus 0.04 Zn and 0.06 B).
- Deep Fertilizer: Average 32-0-0-3 using a 90% Sol 32 and 10% thio-sul.
- 24% received 40-0-0-3 or more.
- 18% received 20-0-0-2 or less.
- 58% received rates between these values.
- Preplant Herbicide: 32 fl oz/acre RT3, and 1 qt/100 NIS at 10 gpa on March 29, 2024.
- In-Crop Herbicide: 5-31-24: 5 fl oz/acre Section 2EC, 12 lb/acre AMS, and 1gal/100 COC at 12 gpa on May 31, 2024.
- Section 2EC is no longer registered in Washington State but was labeled at the time of purchase, and was applied as specified by the label on the container.
- Postharvest Herbicide: 81% of field was sprayed with the WEEDit, applying 26 fl oz/acre Gramoxone SL 3.0, 5.2 fl oz/acre NIS, and 10.4 fl oz/acre COC at 20 gpa on September 4, 2024.
Field 10: Spring Cereal
- Variety and Crop: ‘BG2020’ food grade spring barley.
- Seed Date and Rate: April 18, 2024, at 63 lb/acre.
- Starter Fertlizer: 5.0 gpa liquid blend (7-11-0.4-1 plus 0.04 lb/acre Zn and 0.06 lb/acre B).
- Deep Fertilizer: Average 45-0-0-5 using a 90% Sol 32 and 10% thio-sul.
- 32% received 60-0-0-5 or more.
- 28% received 33-0-0-3 or less.
- 40% received rates between these values.
- Preplant Herbicide: 32 fl oz/acre RT3 and 1 qt/100 Full Load Complete at10 gpa on March 29, 2024.
- In-Crop Herbicide: 15 fl oz Axial Bold, 0.8 oz/acre Affinity Broadspec, 0.75 qt/100 NIS, and 3 gpa Rally fertilizer (3-0-1.1-0 plus 0.1 Mg and 1.1 Cl) at 10 gpa on May 31, 2024.
- Postharvest Herbicide: 27% of field was sprayed with the WEEDit, applying 8.6 fl oz/acre Gramoxone SL 3.0, 1.7 fl oz/acre NIS, and 3.4 fl oz/acre COC at 20 gpa on September 4, 2024.
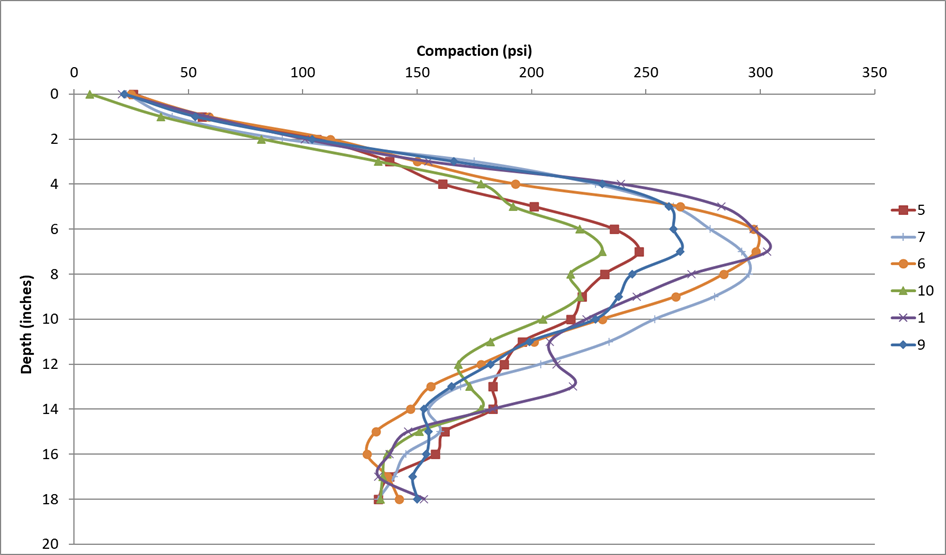
Soil Compaction
Soil compaction data were collected with a Spectrum FieldScout SC900 Soil Compaction Meter. Data were collected within each field in the spring of the year prior to seeding to determine changes in compaction over time. Compaction levels are monitored within each field and within a given crop rotation, which assists in potential management decisions in the future. Figure 1 shows soil compaction data collected in the spring of the year from six fields at the WSU Wilke Research and Extension Farm in 2024.
Soil Samples
Soil samples were collected prior to seeding each crop from three production zones in each field. Data were used to help determine yield potential and nutrient requirements for the crops within these zones. Soil sample data presented on planted crops is an average of the three production zones in each field (Tables 1, 2, 5, 6, 7, 8, 9, and 10). No-till fallow fields are sampled in the same five GPS-marked locations at the same time as those fields being spring-cropped (Tables 3 and 4). The sum of tested nitrogen to a depth of four feet is determined by adding the estimated soil organic matter (SOM) released nitrogen, ammonium nitrogen in the first foot, and the four-foot total of nitrate nitrogen. For example, in Table 11, SOM is 46 lb N/acre, ammonium N is 10 lb N/acre and nitrate N is 144 lb N/acre for a sum of 200 lb N/acre in four feet.
3-Year Crop Rotation
Table 1. Fallow–winter wheat/canola, Field 2. In the top foot, soil pH is 5.3, SOM is 2.3% and will release an estimated 46 lb N/acre, ammonium N is 10 lb N/acre, phosphorus is 20 ppm, and potassium is 609 ppm. The sum of tested nitrogen to a depth of four feet is 200 lb/acre.| Soil Depth (ft) | Nitrate-N (lb/acre) | Sulfate-S (mg/kg) | Soil Water (in) |
|---|---|---|---|
| 1 | 87 | 9 | 1.8 |
| 2 | 18 | 7 | 2.0 |
| 3 | 13 | 8 | 1.4 |
| 4 | 26 | - | 1.3 |
| Total | 144 | 23 | 6.5 |
| Soil Depth (ft) | Nitrate-N (lb/acre) | Sulfate-S (mg/kg) | Soil Water (in) |
|---|---|---|---|
| 1 | 14 | 7 | 2.9 |
| 2 | 21 | 21 | 2.9 |
| 3 | 12 | 5 | 2.2 |
| 4 | 11 | - | 1.9 |
| Total | 57 | 33 | 9.8 |
| Soil Depth (ft) | Nitrate-N (lb/acre) | Sulfate-S (mg/kg) | Soil Water (in) |
|---|---|---|---|
| 1 | 11 | 3 | 2.9 |
| 2 | 12 | 6 | 2.8 |
| 3 | 10 | 8 | 2.3 |
| 4 | 13 | - | 2.3 |
| Total | 46 | 18 | 10.2 |
4-Year Crop Rotation
Table 4. No-till fallow, Field 1. In the top foot, soil pH is 5.3, SOM is 2.9% and will release an estimated 59 lb N/acre, ammonium N is 6 lb N/acre, phosphorus is 20 ppm, and potassium is 671 ppm. The sum of tested nitrogen to a depth of four feet is 145 lb/acre.| Soil Depth (ft) | Nitrate-N (lb/acre) | Sulfate-S (mg/kg) | Soil Water (in) |
|---|---|---|---|
| 1 | 15 | 7 | 3.0 |
| 2 | 13 | 6 | 2.2 |
| 3 | 21 | 4 | 2.8 |
| 4 | 31 | - | 2.3 |
| Total | 80 | 17 | 10.2 |
| Soil Depth (ft) | Nitrate-N (lb/acre) | Sulfate-S (mg/kg) | Soil Water (in) |
|---|---|---|---|
| 1 | 57 | 11 | 2.0 |
| 2 | 20 | 5 | 1.9 |
| 3 | 21 | 6 | 1.4 |
| 4 | 21 | - | 1.3 |
| Total | 118 | 23 | 6.7 |
| Soil Depth (ft) | Nitrate-N (lb/acre) | Sulfate-S (mg/kg) | Soil Water (in) |
|---|---|---|---|
| 1 | 13 | 23 | 0.9 |
| 2 | 6 | 37 | 0.8 |
| 3 | 6 | 5 | 0.7 |
| 4 | 26 | - | 0.8 |
| Total | 50 | 65 | 3.3 |
| Soil Depth (ft) | Nitrate-N (lb/acre) | Sulfate-S (mg/kg) | Soil Water (in) |
|---|---|---|---|
| 1 | 17 | 18 | 2.7 |
| 2 | 19 | 14 | 2.5 |
| 3 | 10 | 5 | 1.9 |
| 4 | 33 | - | 1.6 |
| Total | 79 | 37 | 8.7 |
Continuous Rotation
Table 8. Continuous winter wheat, Field 8. In the top foot, soil pH is 5.7, SOM is 1.5% and will release an estimated 30 lb N/acre, ammonium N is 15 lb N/acre, phosphorus is 26 ppm, and potassium is 392 ppm. The sum of tested nitrogen to a depth of four feet is 88 lb/acre.| Soil Depth (ft) | Nitrate-N (lb/acre) | Sulfate-S (mg/kg) | Soil Water (in) |
|---|---|---|---|
| 1 | 17 | 11 | 1.1 |
| 2 | 8 | 4 | 1.4 |
| 3 | 5 | 42 | 0.8 |
| 4 | 13 | - | 1.0 |
| Total | 43 | 57 | 4.4 |
| Soil Depth (ft) | Nitrate-N (lb/acre) | Sulfate-S (mg/kg) | Soil Water (in) |
|---|---|---|---|
| 1 | 17 | 11 | 1.1 |
| 2 | 8 | 4 | 1.4 |
| 3 | 5 | 42 | 0.8 |
| 4 | 13 | - | 1.0 |
| Total | 43 | 57 | 4.4 |
| Soil Depth (ft) | Nitrate-N (lb/acre) | Sulfate-S (mg/kg) | Soil Water (in) |
|---|---|---|---|
| 1 | 11 | 14 | 2.6 |
| 2 | 8 | 10 | 2.4 |
| 3 | 7 | 11 | 1.6 |
| 4 | 10 | - | 1.5 |
| Total | 37 | 35 | 8.2 |
Soil pH and KCl Extractable Aluminum (Al)
Soil pH and exchangeable Al soil samples are collected prior to seeding in fields planted to spring crop and no-till fallow (NTF). Soil samples are collected from the same five GPS locations where soil compaction is collected. Samples are collected at a depth of 0–3, 3–6, and 6–12 inches. Aluminum toxicity traditionally begins to occur when soil pH levels are less than 5.0 and KCl extractable Al measurements are greater than 25 ppm. At a depth of 0–3 inches, soil pH levels are above 5.0, and KCl Al ranged from 1.1 to 13.2 ppm (Table 11). At a depth of 3–6 inches, soil pH levels ranged from 4.9 to 5.3, and KCl Al ranged from 3.7 ppm in Field 10 to 25.8 ppm in Field 1 (Table 12). At a depth of 6–12 inches, pH ranged from 6.1 to 6.3, and KCl Al ranged from 0.4 to 2.7 ppm (Table 13).
Table 11. Soil pH and KCl extractable aluminum at a soil depth of 0–3 inches in six fields at the WSU Wilke Research and Extension Farm in the spring of 2024.| Soil Indicator | Field 1 (NTF) | Field 5 (SWSW) | Field 6 (mustard) | Field 7 (NTF) | Field 9 (canola) | Field 10 (barley) |
|---|---|---|---|---|---|---|
| pH | 5.3 | 5.2 | 5.2 | 5.2 | 5.2 | 5.4 |
| KCl Al (ppm) | 3.2 | 4.9 | 13.2 | 10.4 | 4.1 | 1.1 |
| Soil Indicator | Field 1 (NTF) | Field 5 (SWSW) | Field 6 (mustard) | Field 7 (NTF) | Field 9 (canola) | Field 10 (barley) |
|---|---|---|---|---|---|---|
| pH | 4.9 | 5.1 | 5.1 | 5.2 | 5.0 | 5.3 |
| KCl Al (ppm) | 25.8 | 24.2 | 21.6 | 15.8 | 16.1 | 3.7 |
| Soil Indicator | Field 1 (NTF) | Field 5 (SWSW) | Field 6 (mustard) | Field 7 (NTF) | Field 9 (canola) | Field 10 (barley) |
|---|---|---|---|---|---|---|
| pH | 6.2 | 6.3 | 6.2 | 6.2 | 6.2 | 6.1 |
| KCl Al (ppm) | 2.7 | 0.7 | 0.8 | 1.2 | 0.7 | 0.4 |
Production and Economic Performance
Nitrogen uptake efficiency (NUE) was at or above 50 percent for all four soft white winter wheat (SWWW) fields (Table 14). For fields at or above 50 percent, this implies the nitrogen fertilizer program was adequate, and an average amount of nitrogen should be available in the soil for next year’s production. Field 5 was soft white spring wheat (SWSW) and had NUE of 44 percent, which implies the crop was overfertilized or fertilizer timing could be adjusted. Above-average fertilizer should be available for next year’s production in this field. Soft white wheat traditionally requires 2.7 lb N/bu, and in 2024, across the farm, it ranged from 2.7 to 3.6 lb N/bu.
Table 14. Nitrogen use efficiency by field in 2024.| NUE Components | Field 2 (SWWW) | Field 3 (SWWW) | Field 4 (SWWW) | Field 5 (SWSW) | Field 8 (SWWW) |
|---|---|---|---|---|---|
| Soil Test Nitrogen* | 180 | 132 | 95 | 97 | 85 |
| Applied Nitrogen | 73 | 114 | 79 | 54 | 78 |
| Total Nitrogen | 253 | 246 | 174 | 151 | 163 |
| Grain Yield | 85.8 | 70.6 | 54.3 | 42.2 | 56.2 |
| Grain Protein | 9.8% | 9.9% | 10.8% | 10.5% | 9.9% |
| lb N/bu | 3.0 | 2.7 | 3.2 | 3.6 | 2.9 |
| Nitrogen Uptake Efficiency | 50% | 55% | 51% | 44% | 51% |
*Soil test nitrogen is calculated by inputting soil test results into the WSU Dryland Wheat Nitrogen Fertilizer Calculator.
Freezing temperatures on May 1, May 2, and May 7 severely damaged spring canola and mustard seedlings resulting in reseeding. Freezing nights were also recorded on May 18 and June 16, which limited yields of all crops. The WSU Wilke Farm grain marketing plan, which begins once the crop has emerged, uses forward contracts and postharvest selling. All grain is marketed by November 15. The average marketing window for winter wheat is about 13 months, and 7 months for spring crops. Forward contract values do not exceed the crop revenue insurance coverage value. The potential for a forward contract is evaluated monthly and is based on a targeted rate of return on investment based on estimated expenses. In 2024, 48% of the SWWW crop was forward contracted, and no canola was forward contracted. Both mustard and barley were raised under production contracts. Market grades for each crop are provided as these also impact the final market price.
Average input costs per year at the WSU Wilke Farm were up 6% over the three-year average (2021–23). However, economic returns over input costs were down 49%. Tables 15–20 summarize the rotation, production, and economic performance of the three-year rotation, four-year rotation, and continuous cropping system at the Wilke Farm in 2024.
Return above input costs per rotation is calculated by multiplying each field’s return over costs by the acre to find the total return over cost and dividing it by the total acres in the rotation. The three-year crop rotation returns above input costs averaged $91.89/acre, 39% less than the three-year average. The four-year crop rotation returns above input costs averaged $111.37/acre, 42% less than the previous three-year average. The continuous cropping system returns above input costs averaged $66.43/acre, 65% less than the previous three-year average. The WSU Wilke Farm is enrolled in the USDA Farm Program and purchases crop insurance each year. Revenue associated with the farm program is not included, but revenue and costs associated with crop insurance are included in the field summaries.
Table 15. Three-year cropping rotation sequence at the Wilke Farm from 2020 to 2025.| Year | Field 2 | Field 5 | Field 7 |
|---|---|---|---|
| 2020 | No-till Fallow | Winter Wheat/Canola (76 bu/acre; 2,080 lb/acre) | Spring Wheat (55.5 bu/acre) |
| 2021 | Winter Wheat (55.5 bu/acre) | Spring Wheat (24.3 bu/acre) | No-till Fallow |
| 2022 | DNS Wheat (38.8 bu/acre) | No-till Fallow | Winter Wheat (77.5 bu/acre) |
| 2023 | No-till Fallow | Winter Wheat/Canola (72.0 bu/acre; 1,053 lb/acre) | Spring Wheat (38.7 bu/acre) |
| 2024 | Winter Wheat/Canola (85.8 bu/acre; 1,935 lb/acre) | Spring Wheat (42.2 bu/acre) | No-till Fallow |
| 2025 | Spring Cereal | No-till Fallow | Winter Wheat/Canola |
| - | Field 2 | Field 2 | Field 5 | Field 7 |
|---|---|---|---|---|
| Acreage | 16.1 | 9.0 | 26 | 35.1 |
| Variety/Crop | ‘LCS Kraken AX’ SWWW | ‘Plurax’ Winter Canola | ‘Ryan’ SWSW | No-till fallow |
| Yield | 85.8 bu/acre | 1,935 lb/acre | 42.2 bu/acre | - |
| Mkt Grade | #1 SWH, 60.0, 0.3% dockage | #1 non-GMO canola, 2.4% dockage | #2 SWH, 59.5, 0.7% dockage | - |
| Mkt Price | $5.30/bu | $0.1935/lb | $5.25/acre | - |
| Crop Sales Income | $454.74/acre | $374.42/acre | $221.55/acre | - |
| Insurance Income | $47.52/acre | $20.11/acre | $32.62/acre | - |
| Gross Economic Returns | $502.26/acre | $394.53/acre | $254.17/acre | - |
| Seed Cost | $29.25/acre | $68.44/acre | $28.17/acre | - |
| Fertilizer Cost | $86.32/acre | $74.83/acre | $66.22/acre | - |
| Herbicide Cost | $60.05/acre | $24.87/acre | $24.09/acre | $37.64/acre |
| Insecticide Cost | - | $16.18/acre | - | - |
| Insurance Cost | $28.51/acre | $21.44/acre | $30.18/acre | - |
| Total Costs | $204.13/acre | $205.76/acre | $148.66/acre | $37.64/acre |
| Return over Costs | $298.13/acre | $188.77/acre | $105.51/acre | -$37.64/acre |
| Year | Field 1 | Field 3 | Field 4 | Field 6 |
|---|---|---|---|---|
| 2020 | No-till Fallow | Winter Wheat (99.2 bu/acre) | Winter Barley (1.82 ton/acre) | Spring Canola (1,755 lb/acre) |
| 2021 | Winter Wheat (60.2 bu/acre) | Spring Canola (not harvested, frost) | No-till Fallow | Spring Wheat (21.4 bu/acre) |
| 2022 | Spring Canola (1,290 lb/acre) | Winter Wheat (67.9 bu/acre) | Winter Wheat (90.4 bu/acre) | No-till Fallow |
| 2023 | Winter Wheat (37.4 bu/acre) | No-till Fallow | Spring Canola (1,600 lb/acre) | Winter Wheat (73.3 bu/acre) |
| 2024 | No-till Fallow | Winter Wheat (90.6 bu/acre) | Winter Wheat (54.3 bu/acre) | Yellow Mustard (399 lb/acre) |
| 2025 | Winter Wheat | Broadleaf | No-till Fallow | Winter Wheat |
| - | Field 1 | Field 3 | Field 4 | Field 6 |
|---|---|---|---|---|
| Acreage | 18.1 | 27.2 | 25.7 | 29.5 |
| Crop | No-till Fallow | ‘Sockeye CL+’ SWWW | ‘Sockeye CL+’ SWWW | ‘IdaGold’ Yellow Mustard |
| Yield | - | 90.6 bu/acre | 54.3 bu/acre | 399 lb/acre |
| Mkt Grade | - | #2 SWH, 59.2, 0.3% dockage | #2 SWH, 58.3, 0.5% dockage | #1 SWH, 61.8, 0.2% dockage |
| Mkt Price | - | $5.26/bu | $5.22/bu | $0.37/lb |
| Crop Sales Income | - | $476.56/acre | $283.45/acre | $147.63/acre |
| Insurance Income | - | $47.52/acre | $14.74/acre | $24.75/acre |
| Gross Economic Return | - | $524.08/acre | $298.19/acre | $172.38/acre |
| Seed Cost | - | $29.41/acre | $29.41/acre | $59.65/acre |
| Fertilizer Cost | - | $117.38/acre | $88.00/acre | $47.27/acre |
| Herbicides Cost | $39.65/acre | $39.71/acre | $53.62/acre | $23.59/acre |
| Insurance Cost | - | $28.51/acre | $28.51/acre | $9.06/acre |
| Total Costs | $39.65/acre | $215.01/acre | $199.54/acre | $139.57/acre |
| Return over Costs | -$39.65/acre | $309.07/acre | $98.65/acre | $32.81/acre |
| Year | Field 8 | Field 9 | Field 10 |
|---|---|---|---|
| 2020 | Spring Wheat (59.5 bu/acre) | Spring Wheat (49.6 bu/acre) | Spring Wheat (49.6 bu/acre) |
| 2021 | No-till Fallow | Spring Canola (705 lb/acre) | Spring Wheat (20.3 bu/acre) |
| 2022 | Winter Wheat (83.9 bu/acre) | Winter Wheat (51.7 bu/acre) | Spring Canola (1,336 lb/acre) |
| 2023 | Yellow Mustard (755 lb/acre) | Spring Barley (1.43 ton/acre) | Winter Wheat (45.2 bu/acre) |
| 2024 | Winter Wheat (56.2 bu/acre) | Canola (806 lb/acre) | Spring Barley (0.77 ton/acre) |
| 2025 | Spring Cereal | Winter Wheat | Broadleaf |
| - | Field 8 | Field 9 | Field 10 |
|---|---|---|---|
| Acreage | 26.9 | 31.4 | 32.5 |
| Crop | ‘Castella Club’ Winter Wheat | ‘Invigor L345P’ Spring Canola | ‘BG2020’ Spring Barley |
| Yield | 56.2 bu/acre | 806 lb/acre | 0.77 ton/acre |
| Mkt Grade | #1 WHC, 59.5, 1.0% dockage | #1 GMO, 2.3% dockage | Non-standard, 47.0, 0.89% dockage |
| Mkt Price | $5.24/bu | $0.186/lb | $284/ton |
| Crop Sales Income | $294.49/acre | $149.92/acre | $218.68/acre |
| Insurance Income | $14.74/acre | $65.55/acre | $39.66/acre |
| Gross Economic Return | $309.23/acre | $215.47/acre | $258.34/acre |
| Seed Cost | $24.70/acre | $140.00/acre | $25.72/acre |
| Fertilizer Cost | $90.55/acre | $42.54/acre | $63.98/acre |
| Herbicide Cost | $34.37/acre | $50.52/acre | $35.57/acre |
| Insurance Cost | $28.51/acre | $24.28/acre | $15.54/acre |
| Total Costs | $178.13/acre | $257.34/acre | $140.81/acre |
| Return over Costs | $131.10/acre | -$41.87/acre | $117.53/acre |
Weather
Weather data in 2024 (Table 21) and 2023 (Table 22) are provided. Overall, May was colder than average with 18% less growing degree days (GDD) than the previous ten-year average.
Table 21. Weather data for Davenport, Washington in the 2024 crop year (September 1, 2023, to August 31, 2024). Temperatures are recorded in degrees Fahrenheit (°F).| Month | High Temperature | Low Temperature | Mean Temperature | Growing Degree Days† | Rainfall (in.) | Rain Days |
|---|---|---|---|---|---|---|
| 9 | 71.2 | 45.8 | 58.9 | 805 | 0.72 | 6 |
| 11 | 57.2 | 35.7 | 45.7 | 504 | 0.57 | 9 |
| 11 | 39.6 | 27.5 | 33.1 | 122 | 1.56 | 10 |
| 12 | 36 | 28.1 | 32.2 | 45 | 2.88 | 14 |
| 1 | 30.3 | 20.4 | 25.4 | 55 | 1.57 | 14 |
| 2 | 39.5 | 28.6 | 33.8 | 97 | 1.49 | 15 |
| 3 | 49.5 | 28.5 | 39.0 | 236 | 0.59 | 7 |
| 4 | 56.0 | 33.2 | 44.8 | 378 | 0.84 | 5 |
| 5 | 64.4 | 38.8 | 52.7 | 608 | 0.93 | 4 |
| 6 | 72.5 | 44.0 | 59.7 | 788 | 0.72 | 6 |
| 7 | 88.8 | 56.0 | 74.1 | 1,253 | 0.00 | 0 |
| 8 | 82.4 | 53.2 | 68.8 | 1,110 | 0.11 | 2 |
| Total | - | - | - | 6,001 | 11.09 | 84 |
†Growing degree calculated using 32°F as the base temperature.
Table 22. Weather data for Davenport, Washington, in the 2023 crop year (September 1, 2022, to August 31, 2023). Temperatures are recorded in degrees Fahrenheit (°F).| Month | High Temperature | Low Temperature | Mean Temperature | Growing Degree Days† | Rainfall (in.) | Rain Days |
|---|---|---|---|---|---|---|
| 9 | 76.2 | 48.2 | 62.2 | 905 | 0.40 | 4 |
| 11 | 65.7 | 40.5 | 52.3 | 654 | 0.37 | 4 |
| 11 | 32.8 | 18.5 | 25.7 | 20 | 0.79 | 9 |
| 12 | 24.5 | 14.0 | 20.4 | 7 | 2.90 | 7 |
| 1 | 32.9 | 23.7 | 28.7 | 26 | 1.56 | 12 |
| 2 | 37.3 | 21.3 | 28.6 | 45 | 0.36 | 4 |
| 3 | 43.8 | 26.4 | 34.6 | 122 | 0.67 | 10 |
| 4 | 54.5 | 31.9 | 43.5 | 336 | 1.74 | 11 |
| 5 | 72.5 | 47.5 | 60.4 | 868 | 0.89 | 9 |
| 6 | 76.0 | 49.1 | 63.8 | 916 | 0.66 | 5 |
| 7 | 85.8 | 54.5 | 71.6 | 1,181 | 0.27 | 2 |
| 8 | 83.1 | 55.1 | 69.8 | 1,151 | 0.48 | 7 |
| Total | - | - | - | 6,232 | 11.09 | 84 |
†Growing degree calculated using 32°F as the base temperature.
Summary
A summary of WSU Wilke Research and Extension Farm economic returns over input costs using three-year averages is shown in Figure 2.
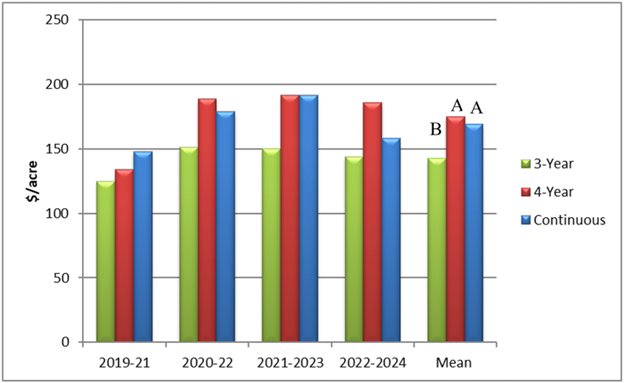
The chart compares economic returns ($/acre) for three cropping systems over four time periods plus an overall mean. The y-axis ranges from 0 to 250 $/acre.
- 2019–21: 3-Year ≈125, 4-Year ≈135, Continuous ≈150
- 2020–22: 3-Year ≈150, 4-Year ≈190, Continuous ≈180
- 2021–2023: 3-Year ≈150, 4-Year ≈190, Continuous ≈190
- 2022–2024: 3-Year ≈140–145, 4-Year ≈185, Continuous ≈160
- Mean: 3-Year ≈140 (labeled B), 4-Year ≈175 (A), Continuous ≈170 (A)
Across all periods, the 4-Year system consistently produces the highest returns, followed by Continuous, with 3-Year lowest. The mean comparison indicates that 4-Year and Continuous are statistically similar and both outperform the 3-Year system.
WSU Wilke Research Plots
Research and outreach are a large component of the farm. In 2023–24, there were 13.75 acres of Farm Service Agency (FSA) certified research plots in the fall and an additional 2.0 acres certified in the spring. These are mostly small research plots established and harvested with plot equipment. Large-scale research plots are not certified as research, because they are harvested with the commercial combine and grain is taken to the warehouse. Below is a list of the projects being conducted on the farm.
Small Plots
- University of Idaho. “Spring Canola Variety Plots.” This project helps companies bring the best canola genetics to market and helps farmers with selecting the best genetics.
- University of Idaho. “Winter Canola Variety Plots.” This project helps companies bring the best canola genetics to market and helps farmers with selecting the best genetics.
- Arron Carter, WSU. “Soft White Wheat Breeding Plots.” These are the advanced generation selections for the intermediate rainfall zone.
- Aaron Esser, WSU. “Spring Cereal Seed Treatment Studies.” These studies look at biological and fungicidal seed-applied products to reduce disease and improve yield.
- Aaron Esser, WSU. “Mycorrhiza Application in Winter Wheat.” This study examines commercially available mycorrhiza products applied to winter wheat following both winter spring canola.
- Aaron Esser, WSU. “Pivot Bio Evaluation in Winter Wheat on Fallow, Continuous Winter Wheat, and Spring Wheat.”
- Ian Burke, WSU. “Herbicide Evaluation.” This project is examining many different compounds for weed control in predominate wheat production systems.
- Michael Pumphrey, WSU. “Liming and Aluminum Tolerant Varieties of Wheat Interaction.”
- Garett Heineck, USDA/ARS. “Kernza Perennial Cropping System.”
- Don Llewellyn, WSU Extension. “Forage Evaluation for Dryland Agriculture.”
- Haly Neely, Shikha Singh, Don Lewellen, and Aaron Esser. “Cover Crop Mix Feasibility.”
- Shikha Singh, WSU. “Spring Peola Feasibility.”
- Clark Neely, WSU. “Spring Legume Variety Trial.”
Large Plots
- Aaron Esser, WSU. “Benefits of Spring Fungicide and Pi-Dust Application in Winter Wheat Production.”
- Jesse Ford, WSU. “Spring Canola Variety Plots.” This project evaluated six spring canola varieties and is designed to help farmers select the best genetics for their situation.
- Ian Burke, WSU. “Compost Application and Winter Pea Production Feasibility in the Intermediate Cropping System.” This study was initiated in the fall of 2016.
- Aaron Esser, WSU. “Calcium Carbonate Application to Improve Soil pH and Improve Profitability.” This study was initiated in the fall of 2016.
- Aaron Esser, WSU. “Value of Incorporating Spring Canola and Chickpea into Cereal Grain Cropping Systems.” This study was initiated in the spring of 2014.
- Aaron Esser, WSU. “Cover Crop Feasibility as a Replacement for Summer Fallow Systems.”
- Haly Neely, Shikha Singh, Don Lewellen, and Aaron Esser. “Long-Term ‘Cow Chow’ Cover Crop Feasibility.”
Special Thanks
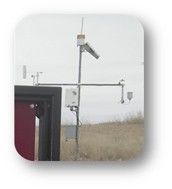
AGWEATHERNET STATION located at the Wilke Research and Extension Farm.
You can access Wilke weather data at AgWeatherNet | Washington State University (wsu.edu).
AgWeatherNet link on the widget takes you to a map of weather stations throughout the state.
For additional information, please contact Aaron Esser, aarons@wsu.edu, 509-660-0566.
By,
Aaron Esser, Wilke Farm Management Committee Chair, Washington State University
Derek Appel, Wilke Farm Manager, Washington State University

TB110E

Copyright © Washington State University
WSU Extension publications contain material written and produced for public distribution. Alternative text descriptions for select complex images were generated using ChatGPT (OpenAI), then reviewed and adapted to ensure compliance with Web Content Accessibility Guidelines (WCAG) accessibility standards.
Issued by Washington State University Extension and the US Department of Agriculture in furtherance of the Acts of May 8 and June 30, 1914. Extension programs and policies are consistent with federal and state laws and regulations on nondiscrimination regarding race, sex, religion, age, color, creed, and national or ethnic origin; physical, mental, or sensory disability; marital status or sexual orientation; and status as a Vietnam-era or disabled veteran. Evidence of noncompliance may be reported through your local WSU Extension office. Trade names have been used to simplify information; no endorsement is intended.